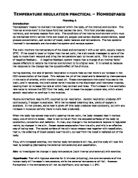
As well as the strength testing physical characteristics was measured, these were muscle girth, skin folds, weight, and measured range of motion of repetition.
Participants
The participants were Students enrolled in a Bachor of Recreation and Sport and the Eastern Institute of Technology.
Of the subjects there were varying states of condition and experience with resistance training. All of the subjects were physically active and competitive in nature, while the subjects were not prepared for the testing, this can be seen as requirement to the randomness of the testing.
Procedure
Dumbbell Curls
The 1RM curls were performed standing against a wall to avoid cheating, the dumbbell was to start at the bottom and be curled up to touch the shoulder(bilateral movement) for a complete repetition with each hand.
80% 1RM Curls
These were performed the same way as the 1RM but at 80% its weight and to be done to failure with each hand. The repetitions and time taken were also recorded.
Barbell Curls
These were performed free standing; with the participant starting with arms extended curling the bar up to chest height to perform one full repetition. The test was performed with no body moment to avoid a misrepresentation of the subject’s strength.
Anthropometric Tests
Anthropometric dimensions taken were fexed arm circumference for the left and right arms with bicep skin folds been taken at this point.
The vertical distance the weight moves was measured, from start to stop point by going through the movement on a white board and measuring the result. The fact that the arc was not taken into account was not deemed important to this study.
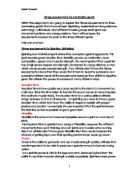
Analysis
Using הּ(C/2הּ - S/2)² in which C= Bicep circumference S= Skin fold, the muscle cross section could be calculated.(Paton, 2007)
Watt production was calculated by multiplying the distance travelled in each repetition by the reps done and then multiply it with the load in Newton’s, this will give the positive work done. To take into account the negative work done multiply the positive work by 1.33 this is an approximation and can be variable.
Then divide the N.m by the time in seconds, then again by 1 to get the watt production(Paton, 2007).
Results
The results shown in these figures show a strong correlation between muscle cross sections and the relationship between dumbbell 1RM with Barbell 1RM. The relationship between the 1RM and 80% RM tests shows a weak correction between muscle strength and muscle endurance.
In figure 1 R2= .89 this shows there is a strong positive correlation between bicep cross section and 1RM for all the subjects.
Figure 1
Figure 2 shows the correlation between the average dumbbell 1RM of both arms and the Barbell 1RM. With an R squared value of .98 this shows a very strong correction
Figure 2
Figure three has a r squared value of .19 which shows a weak negative correlation between the average dumbbell 1RM and the muscle endurance and 80% 1RM
Figure 3
Figure 4 shows the correction between Watts produced and bicep cross section during the 80% 1RM to failure. The R squared value shows a strong correlation between muscle size and work production in the positive phase of the movement.
Figure 4
Discussion
The results shown in figure 1 and 2, illustrate the high correction between 1RM and muscle cross section in the subjects in this test. It also points out that as there were male and females participants there was no significant differences in the 1RM of subjects when shown proportionally to their muscle cross sections. These results have been mirrored in studies quoted in Physiology of Sport and Exercise (Wilmore & Costill, 1994) . They showed no significant differences between the genders in trained bodybuilders proportional to muscle cross sectional area.
The whiskers in figure 1 could be the result of some subjects not having the neuromuscular adaptations to the test exercises as the rest of the participants, thus not been able to achieve their potential.
There were little differences in the 1RM of one arm compared to the 1RM of two arms, with a barbell 1RM equalling twice that of a dumbbell 1RM. This is shown by the R squared value of .92 signifying the high correlation between the two variables.
The results from the 1RM compared with 80% 1RM reps in failure in figure 3 show a weak correlation between muscle strength and muscle endurance. This could be closely related to the differences in training the participants have been involved, in relation to the training of anaerobic energy systems and muscle energy stores.
To illustrate this in appendix 1 highlighted in yellow are to males whose 1RM are similar but their muscle endurances differ by 100%. Of these subjects one is a endurance trained cyclist and has limited gym expertise, the other trains at a gym regularly. They both have similar muscle cross sectional area and one rep maximums but their muscle endurance is significantly different This could be related to the principle of Specificity and the changes in muscle cell structure brought on by the use on different energy systems within the bicep (Wilmore & Costill, 1994)
In figure 4, the relationship between power output and muscle cross section shows a strong correlation and it is reflected in appendix 1 with the two subjects from above who had significant differences in muscle endurance but their power output are similar. This could be proportional to the tension that the muscle can produce from its cross section. (Marieb, 2004)
Conclusion
There is a high correlation between muscle cross section and 1RM
There are no significant differences between genders in relation to 1RM bicep curls and muscle cross sectional area.
There is a weak correlation between muscle cross section and muscle endurance.
There is a correction between muscle power output and muscle cross section area.
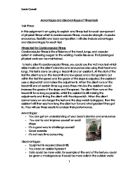
Applicable Uses
Women can be trained the same as men for strength gains.
Athletes’ who require stained high power output should train the energy systems to support them adequately
References
Marieb, E. (2004). Human Anatomy & Physiology (6 ed.). San Francisco: Pearson Benjamin Cummings.
Paton, C. (2007). Strength assessment laboratory . : Eastern Institute of Technology.
Wilmore, j., & Costill, D. (1994). Physiology of Sport and Exercise: Human Kinetics.
W=
Appendix 1