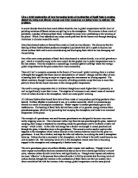
One cannot deny the relationship between these two graphs; as CO2 concentrations increase, the temperature globally increases. When sunlight reaches Earth's surface some is absorbed and warms the earth and most of the rest is radiated back to the atmosphere at a longer wavelength than the sun light. The Earth’s surface is warmed, and radiates infrared into space. This is the Greenhouse Effect. This heat warms the Earth, and without it, life would not exist on Earth, because water would be frozen. Water, as a liquid, is a foundation for life itself. However, when some gases leak into the atmosphere this heat can increase to make an extreme difference. Carbon dioxide, water vapour and methane molecules all absorb this heat, and whilst they linger in the atmosphere, they continue to increase the temperature of the Earth. Nitrogen and oxygen, the main gases of the atmosphere, do not posses this quality. Therefore, the similar correlations between the graphs suggest a relationship between these two factors. If we examine the graphs closely, we observe a large increase in the world’s temperature in 2000, and also a considerably big increase in the concentration of CO2. This could be purely a coincidence; however, due to the evidence scientists give to show that greenhouse gases increase the temperature in the atmosphere. However, just because these graphs show a correlation, we cannot automatically assume that carbon dioxide emissions are the direct cause of global warming. We have to observe other factors also. There is for example, deforestation. Industrialization spreads, and in order to make room for the population increase the world has seen in recent years, trees have to be cut down. One of our oldest resources, wood burns easily and trees are also being used for these purposes along with making paper and cardboard. Trees use up CO2 for respiration, and therefore as we demolish our trees, we destroy a natural way of consuming these gases. We are now left with more carbon dioxide polluting the air, because of the depleting of trees. With other factors taken into account however, we see from these graphs that there is a relationship of great importance between global temperature increase and CO2, and this is vital to understanding ways to prevent global warming from ruining our planet, and devastating our lives.
A report to the Prime Minister
Global warming is a very debatable subject. There are many reasons for why it is happening, and many vague solutions on how we can stop it happening. However, nobody can deny that it is happening and since scientists concluded that it was very likely that as a human race were having some cause towards it we have to act fast. The greenhouse effect is a natural phenomenon cause by radiation of the atmosphere. Heat from the sun passes through the atmosphere, warming it up, and most of it warms the surface of the planet. As the Earth warms up, it emits heat in the form of infra-red radiation - much like a hot pan emits heat even after it's taken away from the cooker. Some of this heat is trapped by the atmosphere, but the rest escapes into space. Greenhouse gases such as methane, carbon dioxide and water vapour make the atmosphere trap more of this radiation, so it gradually warms up more than necessary. These absorbent gases cause trouble by raising the temperature of the planet. The actual rise is not large, but the Earth's ecosystem is delicate, and small changes can have large effects. After the industrial revolution of the 1700’s the greenhouse effect was enhanced by greenhouse gas emissions of CO2 and CH4 (methane). More recently, the production of a refrigerant chemical called the chlorofluorocarbon, or CFC that is used in aerosols has been causing problems. This is because, as a refrigerant it can trap enormous amounts of heat, one molecule of CFC is 12,000 to 16,000 times as effective at absorbing infra-red radiation as a molecule of carbon dioxide.
Why is Carbon Dioxide so important?
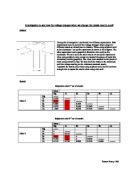
The graph shown illustrates the percentage of each greenhouse gas found in the atmosphere today. It is clear that carbon dioxide is the main pollutant in the atmosphere, and this is probably because that everyday millions of people uses excess CO2 around the house, sitting in traffic or at work. Carbon Dioxide is emitted into the air as humans exhale, burn fossil fuels for energy, and deforests the planet. Every year humans add over 30 billion tons of carbon dioxide in the atmosphere by these processes, and it is up thirty percent since 1750. We use coal, oil and natural gas to generate electricity, heat our homes, power our factories and run our cars. These fossil fuels contain carbon, and when they are burned, they combine with oxygen, forming carbon dioxide. The two atoms of oxygen add to the total weight. Humans are, by using electrical and fossil fuel powered items in everyday life, directly contributing to global warming. Through the greenhouse effect CO2 and the other greenhouse gases are likely to raise the temperature of the earth by up to 4 Co by the end of the century. This may seem like a small insignificant number, but this increase could lead to many disastrous things. Sea levels are likely to rise by 28-43cm due to the polar ice caps melting. These rises are predicted to increase over longer periods of time, and this could lead to many horrible situations.
If sea levels continue to rise further to 1 metre, the entire section filled with red in the picture of Louisiana, USA could potentially be underwater. Millions of homes could be under threat, and Humans are at the centre of all the destruction.
Other Theories of Global Warming
Some scientists deny that CO2 is causing the warming of the planet. One of their theories is that the clouds are thinning, which is leading to more direct sunlight reaching the oceans which are contributing to global warming. They find that as the oceans are becoming warmer the clouds above them are dissipating allowing more sunlight to reach the oceans and warming them even further. However what this theory doesn’t cover is that why the oceans are warming in the first place and this is probably due to the greenhouse effect, and the dissipation of clouds is possibly merely and effect of global warming rather than a cause for it. Another reason why this theory decreases in confidence is that it is difficult to find long term trends in the pattern of the dissipation of clouds, and therefore cannot be classified as a consistent theory.
In Conclusion
Overall, I believe that the contributions to global warming made by CO2 emissions and the greenhouse effect are the most prominent and destructive of them all. The other theories mentioned are valid however the evidence provided for the greenhouse effect and the increased emissions play a more important part in the Earth’s temperature increase. I also believe that humans are actively causing global warming, and the world can be saved if we act fast and decrease our carbon footprint. It is our world and we must protect, or otherwise it may just be too late.