Apparatus used:
- Ammeter
- Voltmeter
- Power pack
- Crocodile clip
- Meter ruler
- thermometer
- Nichrome wire
- Variable resistor
- Wires to connect the circuit
Drawing of how the apparatus was assembled:
Method:
- Collect apparatus
- Set apparatus up as shown above
- Use the crocodile clip to connect the current to the meter stick at the range of 10cm.
- Turn on the power pack and record what the ammeter and voltmeter read.
- If the reading on the ammeter is not 0.2 than use the resistor to make it 0.2.
- Do the same for all the other ranges.
Fair test:
- to make the experiment fair I maintain the control variable which were:
- The current flowing in the circuit should be the same for all the lengths using the variable resistor.
- Turn off the power pack each time before moving on to the next reading.
- Make sure the thickness of the wire is the same through out the whole length as it can affect the resistance of a wire.
- Make sure the temperature was kept Constance as this can also effect the resistance of the wire.
Safety:
- Turn off the circuit each time so the wire doesn’t burn
- Be aware when the circuit is on.
- Do not touch the wire at any time as risk of getting shock.
- Wear goggles all the time.
Ranges:
The difference between reliable and accurate data is that the reliable data will include a diagram with good results; it is not based on luck. The results can be used again and can be repeated for reliability. Accurate data is measured as close as possible for example; all answers are recorded with precision for example the readings on the ammeter will be written down just as they are but might be later rounded up for ease when drawing up a graph. I have collected reliable data because my experiment was repeated 3 times.
I have adequate ranges because I have spaced it out at every 10cm so this should give me better and more accurate results. These ranges increase and as this happens I will be able to see a pattern in the resistance and see whether or not it agrees with my prediction.
How the collected data was made reliable:
- I used a wide range of lengths – 5
- repeated the experiment 3 times so its reliable
- Averaged out the 3 readings
What is resistance?
Resistance is a measure of how hard it is to get a current through a component in a circuit at a particular POTENTIAL DIFFERENCE (Energy transferred per unit charge flowing).
Electricity is conducted through a conductor, in this case wire, by means of free electrons. The number of free electrons depends on the material and more free electrons means a better conductor, i.e. it has less resistance. For example, gold has more free electrons than iron and, as a result, it is a better conductor. The free electrons are given energy and as a result move and collide with neighbouring free electrons. This happens across the length of the wire and thus electricity is conducted. Resistance is the result of energy loss as heat. It involves collisions between the free electrons and the fixed particles of the metal, other free electrons and impurities. These collisions convert some of the energy that the free electrons are carrying into heat.
The current through a circuit can be controlled by varying the resistance in the circuit.
This can be done by using:
-
A fixed resistor: this is a component whose resistance is constant. The bugger its resistance the smaller the current that flows for a particulate potential.
-
A variable resistor: this is a component whose resistance can be altered. The current that flows can be changed by simply moving the sliding contact of the variable resistor from one end to the other.
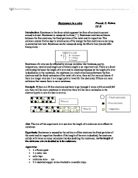
How is it measured?
The resistance of a length of wire is calculated by measuring the current present in the circuit (in series) and the voltage across the wire (in parallel). These measurements are then applied to this formula:
V = I * R where V = Voltage, I = Current and R = Resistance
This can be rearranged to:
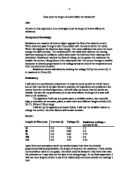
Ohm’s Law
Ohm’s Law states that the current through a metallic conductor (e.g. wire) at a constant temperature is proportional to the potential difference (voltage). Therefore V ¸ I is constant. This means that the resistance of a metallic conductor is constant providing that the temperature also remains constant. Furthermore, the resistance of a metal increases as its temperature increases. This is because at higher temperatures, the particles of the conductor are moving around more quickly, thus increasing the likelihood of collisions with the free electrons. The graph shows what happens to the current and voltage when a resistor follows Ohm’s Law.
The filament lamp
The filament lamp does not follow Ohm’s Law. The resistance of a filament lamp increases as the temperature of its filament increases. As a result, the current flowing through a filament lamp is not directly proportional to the voltage across it. This is the graph of current against voltage for a filament lamp.
The diode
Diodes are electronic components that can be used to regulate the voltage in circuits and to make logic gates. Light-emitting diodes (LEDs) give off light and are often used for indicator lights in electrical equipment such as computers and television sets.
The diode has a very high resistance in one direction. This means that current can only flow in the other direction. This is the graph of current against voltage for a diode.
The Thermistor & the LDR
The Thermistor
Thermistors are used as temperature sensors, for example, in fire alarms. Their resistance decreases as the temperature increases: as shown on the graph.
- At low temperatures, the resistance of a Thermistor is high and little current can flow through them.
- At high temperatures, the resistance of a Thermistor is low and more current can flow through them.
The LDR (light-dependent resistors)
LDRs (light-dependent resistors) are used to detect light levels, for example, in automatic security lights. Their resistance decreases as the light intensity increases:
-
In the dark and at low light levels, the resistance of an LDR is high and little current can flow through it.
- In bright light, the resistance of an LDR is low and more current can flow through it.
Factors affecting Resistance:
- Length of wire – the longer the wire the higher the resistance because in a long wire there are more metal ions for the electrons to pass through.
- Thickness of wire – the thicker the wire the less the resistance because the electrons in a thick wire have more space to pass through the metal iron compare to the thin wire.
- Temperature – the increase in temperature the higher the resistance of a wire because in a warm wire the metal irons have more kinetic energy therefore they move more so it harder for the electrons to pass through.
- Type of wire – for example Nichrome has less resistance compare to copper wire.
Table of result
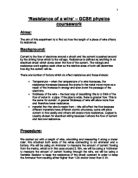
Graph of the result table
Analysis
From my investigation I found out that my predictions was correct that that the longer the wire the higher the resistance this is because in a long wire there are more ions metal so the current (electrons) have to pass through more ions metals compare to a shorter wire.
This pattern can be clear seen on the graph; as the length of the wire (X axes) increases the resistance (Y Axes) also increases; therefore for example at the first length (10cm) of the wire the resistance was 0.65 however at the last (50cm) distance the resistance was 2.5. So the amount of resistance increased from the first distance to the last distance increased by 1.85 resistances.
From my result I can conclude that as the length of the wire increases the resistance also increases because in longer wire there are more metal ions so the current (electrons) have to pass through more ions metals compare to a shorter wire. However my result doesn’t show a definite conclusion because there are were other factors that were affecting the resistance of the wire for example the thickness and the temperature.
Overall, my graphs and results support my prediction fully. My idea that longer the wire the higher the resistance will be was comprehensively backed up by my results.
Evaluation
In my opinion I think the this experiment was quite successful overall, as my result and the graph provide my prediction right which was as the length of the wire increases the resistance will also increase. The method that I used was accurate enough to give me a reliable data however there were some error which affected my results such as the heat generated from the wire as the current was passing through. As I have earlier described, temperature has a very noticeable effect on the resistance of the wire, to make my experiment reliable and fair next time I would use a Thermistors as this decreases the resistance as the temperature increases
I know that I have collected accurate data as my results are repetitive and the same pattern continued each time we did the experiment. If I had estimated the level of resistance then it would have been close to the actual results that I gained.
I didn’t get any anomalies on my graph because the experiment was carried out accurately. I could have scientifically improved the method that I used by using a micrometer screw gauge to measure the thickness of the wire. By using this piece of equipment my experiment would be more accurate
Overall, I believe that my experiment was accurate as the result that I got from this experiment was accurate enough to support and justify my hypotheses and prediction.