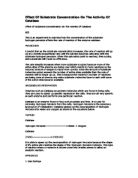
You can clearly see in the graph, which shows that when the concentration of enzyme is maintained constant, the reaction rate will increase as the amount of substrate is increased. However, at some point, the graph shows that increasing the amount of substrate does not increase the reaction rate. The line begins to level off and stay level at B on the graph. This is called Vmax.
At point A there is very little substrate and a lot of enzyme. An increase in the concentration of substrate means that more of the enzyme molecules can be utilized. As more enzymes become involved in reactions, the rate of reaction increases. At some point near B, all the enzymes are being involved in reactions. When this happens, some of the substrate must "wait" for enzymes to clear their active sites before the enzyme can fit with them (like a "lock and key"). After point B, the reaction rate remains flat because increasing amounts of substrate must wait before they can fit with their enzyme.
Also, the chances of the substrate entering an active site will increase. If the amount of enzyme remains constant, the rate of reaction will increase up to a point. The rate of reaction increases until all of the active sites of the enzyme molecule are being used. If excess substrate is added, the rate of reaction will not increase any further because the enzyme is working as fast as it can. At this point, Vmax is constant. Vmax is the maximum rate at which chemical reactions can occur (V = velocity).
The rate of an enzyme controlled reaction increase in proportion to the concentration of the enzyme (assuming there is excess substrate). If substrate is not in excess (e.g. constant) the graph tales off as it comes to a point where the reaction reaches maximum velocity, Vmax.
I predict that the higher the concentration of hydrogen peroxide there is, more oxygen will be produced in the allotted time. When there is a 100% concentration of hydrogen peroxide, in my case 5ml, I think the most oxygen will be produced. From then on, as the concentration gets weaker, I think less oxygen will be produced and at a slower rate. I would expect 100% to react quickest because it has the most hydrogen peroxide molecules in it. With more of these molecules inside the solution, it is more likely that reactions will take place. This means that a reaction is more likely to take place in a shorter time, making the rate of reaction quicker. After 100% producing the most oxygen, I then expect it to be 60% (3ml), then 40% (2ml), and then 20%(1ml). An increase in the substrate concentration will produce a corresponding increase in the rate of reaction. Therefore, when the concentration is doubled, as in from 1ml to 2ml, I also expect the amount of oxygen produced in the reactions to double. I think this because if the solution of hydrogen peroxide is stronger, the catalyse will have more hydrogen peroxide molecules to break down. If there is a weaker concentration of hydrogen peroxide solution, then there will be less hydrogen peroxide molecules for the enzyme to break down, and less oxygen will be produced in the allotted time.
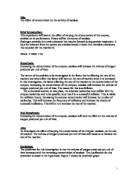
Before any change takes place on collision, the colliding molecules must have a minimum kinetic energy called the Activation Energy shown on the energy level diagrams below (sometimes called reaction profile/progress diagrams).
The purple arrow up represents this minimum energy needed to break bonds to initiate the reaction, which is the activation energy.
Variables
Apparatus
Method
- Take all the safety precautions before the experiment and set up equipment as shown in the diagram.
- Use the syringe to get 5ml of calalase and inject this into the 6 boiling tubes.
- Use the thermometer to check if the temperature on the water bath is at 37 degree.
- Then remove the bung and place the with the delivery tube. Inject the peroxide into the boiling tube via the bung. Cover the hole with plastercine and start the stopwatch.
- Record the change in oxygen every 30 second for 2 minutes 30 seconds.
- Do the same for all concentrations on the dilution table and repeat each dilution twice.
Dilution table
Percentage error – showing us how accurate the experiment was
Percentage error = (error / reading) x 100
Syringe (10ml) – 0.1/10 x 100 = 1%
Burette (25ml)- 0.05/25 x 100=0.2%
Total Percentage error = 1 + 0.2%=1.2%
Overall the percentage error is quiet low, which suggest that my result is really accurate.
Safety
To ensure safety during the experiment, safety precautions must be met which include:
- Wearing safety goggles or glasses to protect chemicals such as iodine in this case from going in the eyes.
- Standing up and making sure nothing is in the way such as bags and coats/jackets.
- Make sure the equipment require is only on the work surface to prevent accidents.
- Keeping breakable equipment such as boiling tubes away from the edge of the table or work surface.
Empty result table
Analysis
The results show that as the concentration of hydrogen peroxide decreases, the amount of oxygen being released into the measuring cylinder also decreased. This is because the reaction was working at a slower rate due to the fact that the water had diluted the solution. The result of dilution means that there would be fewer enzymes to react with and therefore less oxygen would have been produced.
This confirms what I said in my prediction, because as the concentration of hydrogen peroxide was weakened, there were fewer hydrogen peroxide molecules for the catalyse to break down, therefore less hydrogen peroxide was broken down and less oxygen was produced.
According to the biological theory, the rate of an enzyme controlled reaction increases in proportion to the concentration of the enzyme (assuming there is excess substrate). The 0.4M concentration is twice as strong as the 0.2M concentration so the rate of reaction should be double what it was for the 0.2M concentration. The relationship between rate of reaction and concentration should be linear i.e. by doubling the concentration of H²0² you double the rate of reaction.
My prediction that the 100%(5ml) concentration would produce the most oxygen in the shortest time was correct, and I was also correct in thinking that 60% would be next, then 40% and then 20%. There is a pattern to the results, as the rate of reaction decreases when the concentration does.
My results support my original predictions. The higher the concentration of substrate, the quicker the rate of reaction because there are more molecules for the enzyme to break down. As a result of this more oxygen can be produced, and my results, averages and graph show this. The graph also supports this, with the total average volume of oxygen increasing along with the concentration of the substrate.
When the concentration of the substrate doubles, i.e. from 20% to 40%, I expected the amount of oxygen to exactly double with it. In one of the experiments, this did happen. The amount of oxygen in the 2minutes 30 seconds was 3.16cm for the 20% and 6.62cm for the 40%, which shows a clear double in the results. As you can see from the graph, the rate of reaction does increase when the H²0² concentration increases. From looking at my graph we can see that when the concentration of the hydrogen peroxide is 0.2 Molar the amount of oxygen produced is 3.16 cm3 and when the concentration is 1.0 Molar the oxygen produced is 15.00 cm3. These results show that a strong concentration will produce more oxygen than a weak concentration.
Rate of reaction = the amount of oxygen / time
The graph below shows the rate of the reaction:
The line has the classic shape of a rate of reaction graph. It starts off steep, becoming shallower until it levels off. This can tell the rate of reaction at any particular time by the slope (gradient) of the line.
The steeper the slope of the graph, the faster the reaction at that point. At the beginning, the reaction goes faster because there are more reactants to react. Whereas at the end, the reaction is slowing down because there are not enough reactants to react.
Evaluation
Overall I think this experiment is really successful due to the fact that all my results matched my prediction. There are only a few anomalous results as shown on the graph, which is circled. However, most of my result is lie on the line of best fit
Reliability-This investigation could have been more reliable but it was limited to the resources of the school. This meant that only two sets of results could have been taken. This reduced the reliability of the investigation because the averages of two sets of results are not as good as three sets. If the investigation were done again a minimum of 3 set would be taken. This would increase reliability of the results. This would allow the results to be more valued so the analysis could be proven. Overall this investigation has gone well. The results would have been better if 3 sets had been taken by the schools resources limited it to only two.
Here is a table to show how reliable my results are.
For accuracy I tried to be as accurate as possible, however there were some things I didn't control. The results might not have been as accurate as they could have been when timing. I only used a stopwatch, which relied on my reaction, to stop the stopwatch. Everyone's reaction times are different so is not particularly the most accurate way of timing.