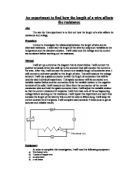
Equipment
In order to complete this investigation, I will need the following equipment:
- Two battery cells
- 7 pieces of copper wire
- an amp meter
- a volt meter
- a variable resistor
- 120cm of constantan wire
- a spade connector
Key factors
I could choose to use one of several variables in this investigation. These are the type of wire (material), the diameter of the wire, the temperature of the wire, the current flowing through it or the voltage. In this case, I have chosen to vary the length of the constantan wire. The dependant variable will be the voltage, and hence the calculated resistance, because I have decided to maintain a constant amperage of 0.2 amperes.
Safety
I was extremely careful when using the equipment to ensure maximum safety. For example, I kept the temperature of the wire low. I achieved this by maintaining constant low amperage of 0.2 amperes. I ensured that my equipment was sufficient for the investigation by making sure that it was as clean as possible. This also helped to maintain a sufficient degree of accuracy during my investigation.
Hypothesis
I predict that there will be a direct correlation between the length of wire and the resistance, i.e. ‘the longer the wire the greater the resistance’.
Justification of prediction
I am basing my prediction on the scientific knowledge that, as the length of the wire increases, so do the opportunities for the electrons to collide with a positive ion. The opportunities increase because there is a greater distance for the electrons to travel. Energy is given out from the collision of these collisions in the form of heat.
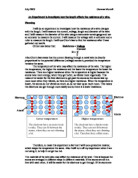
The results
I have used the ‘Ohm’s law’ formula to get a resistance for my results, i.e. R= V/I
I have highlighted the anomalies in red.
Accuracy of results
To ensure that I had an accurate and sufficient range of results, I carried out each individual experiment 5 times. This was as many as I could have done in the time I was given. The accuracy was improved because I took an average from each of the results. This made my results a lot more reliable and easier.
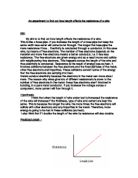
Analysis
What do these results mean?
These results support my prediction entirely. In the planning section, I wrote ‘I predict that there will be a direct correlation between the length of wire and the resistance, i.e. ‘the longer the wire the greater the resistance’. My results support my prediction that as the length of the wire increases, the resistance also increases.
My line graphs show that the resistance readings are more or less the same, in relation to the length of constantan wire, and the current was maintained a constant level. This proves that the voltage is merely a dependent variable and that the resistance relies upon the current flowing through the wire. My graph also tells us that the length of wire does affect the resistance. This is because, as the length of constantan wire increases, so does the average reading for each of the five resistance readings.
The length of the wire is directly proportional to the resistance, as I have predicted. This means that, for example, as the length of wire doubles, the resistance also doubles. This is because in twice the amount of wire, electrons are twice as likely to collide with positive ions. They will be slowed down by these collisions and lose some of their energy to the positive ions.
Evaluation
I believe the degree of accuracy that I worked to was sufficient for the time and space available to me for this investigation to be completed. The level of accuracy in this investigation met the level that was required of me.
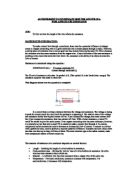
Anomalies
The time I had been allocated made it very difficult to achieve 100% accuracy for my experiments. This meant that there were, inevitably, always going to be some anomalies. Ideally, we would want all of the resistance’s for each length of wire to be the same and so there would be a range of 0. Unfortunately due to factors such as inaccurate equipment, measurements were taken by eye, the wire may have had kinks in it, fluctuating laboratory temperatures and the improper use of flickering voltmeters and ammeters there was always going to be some varying results. Because of these ranges of readings due to experimental errors, I have set the cut off line at 0.7 ohms. Anything above this cut-off line, I have identified as an anomaly. I think o.7 ohms are quite a sufficient margin for error. Therefore, as you can see from the graph, the readings taken from 30, 50 and 70cm all contain anomalies. If we look at the charts in the obtaining section we can see that all of these anomalies occurred at the fifth experiment for each of them. I have already listed some of the reasons why these may have occurred above.
Improvements
If I were to repeat the experiment, I could make several improvements to improve the level of such factors as accuracy and safety. For example, I could ensure that the connections were securely fastened or even bolted to increase both safety and accuracy. I could also get as many opinions as possible or get some sort of machine to measure the length of the constantan wire. I could increase the number of times I carry out each of the scenarios. This would improve accuracy even more. I would check the wire and ensure that there were no bends or kinks in it because this would affect the flow of electrons through it.
Further work
If I were ever to do this experiment again, I could consider investigating another of the key factors involved with this investigation. For example, I could change the type of wire, the temperature of the wire, the diameter/width of the wire. I could also choose to vary the current or the voltage and, therefore change the dependent variable as well.