An experiment to find the resistivity of nichrome
An experiment to find the resistivity of nichrome
A. Planning
Plan of the method to be used: -
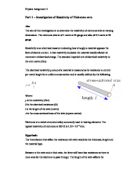
The resistivity of nichrome can be determined using the equation ??=?RA/L
Where:
R:- Is the resistance of the wire in ?"ohms" and can be determined using the equation R=V/I where "V" is voltage in volts and "I" is current in
Amperes.
L:- Is the length of the nichrome wire used in metres.
A:- Is the cross-sectional area of the wire in metres square and can be determined using the equation A= ??d2 where "d" is the diameter of the wire.
If I plot a graph of length on the x-axis against resistance on the y-axis. From the relation R = ? L /A which corresponds to the st. line equation ?
y=mx the graph should be a st. line passing through the origin where "m" is the gradient of the st. line graph and corresponds to ?/A. Since the cross-sectional area of the wire can be found by knowing it's diameter. Therefore the resistivity of nichrome can be calculated.
?
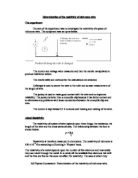
Diagram of the circuit used in this experiment
List of the apparatus used: -
- Power pack supply of 4V
2-A variable resistor
3-A full scale deflection ammeter with a measuring range of 0-1 A
4-A digital voltmeter with a measuring range of 0-5 V
5-P, Q represents terminal blocks.
6-Circuit wires
7-PQ=Nichrome wire
8-A meter ruler
9-Michrometer screw-gauge
0-Sellotape
Detailed method: -
I set up the circuit as shown in the diagram that I have drawn. I started the experiment by taping a meter ruler between the terminal blocks P, Q so that I could measure 100cm of nichrome wire. I made sure that the wire was carefully tightened at both terminals to try to minimise the kinks or twists in the wire. I then switched on the power pack supply and adjusted the variable resistor until a constant current of 0.2A was
flowing through the circuit. I then recorded the corresponding voltage reading that was displayed on the digital voltmeter. I repeated this procedure using different lengths ranging from 30-100cm and adjusting the variable resistor until 0.2A was flowing through the circuit. After recording the corresponding voltage readings for each length and tabulating them I decided to repeat the whole experiment again another 2 times so that I could take the average voltmeter reading for each length. Using a micrometer screw-gauge I measured the diameter of the wire at 3 different positions along the wire and then calculated its average diameter from the 3 values. I then plotted a graph of the length of the wire against average resistance and used it to calculate the resistivity of nichrome as mentioned in my plan where the average resistance can be calculated using the relation??? R=??V .
I
Variables in the experiment: -
*In this experiment I varied the length of the wire each time using a range of lengths from 30-100cm.
*I kept the current flowing through the circuit constant using a variable resistor which I kept varying for each length of wire so that the ammeter would always read 0.2 A. I then recorded the voltage readings from the voltmeter which corresponded to the length of the wire being used.
*The temperature of the wires in the circuit needed to be kept constant to prevent the whole circuit from overheating. I managed to do this by quickly switching off the power pack supply every time I had recorded my set of readings. I then left the power pack to rest for a small interval of time before switching it on again to record the next set of readings.
* I also kept the diameter of the wire constant by using the same piece of wire throughout the whole experiment.
Justification of the equipment range: -
Ammeter: - I used a full scale deflection ammeter of current range from 0-1A because I only wanted to measure small currents passing through the circuit and not large currents however all the digital ammeters that were available had a current range of 0-20A and there weren't any available digital ammeters that had a current range from 0-1A. I chose to keep the current passing through the circuit constant by passing a small current of 0.2A throughout the whole experiment. This maintained the temperature of the wires in the circuit because large currents would heat up the wires thus damaging the circuit and affecting the resistivity of nichrome.
Voltmeter: - I chose to use a digital voltmeter of range 0-5V instead of a full-scale deflection voltmeter to avoid parallax error when recording the voltage readings. It would have been ideal for me to have used a digital voltmeter of range 0-2V but this type of voltmeter was unavailable. The only digital voltmeters that were available for me to use had either a voltage range from 0-1V or from 0-5V or from 0-20V.When I did a preliminary experiment I found that the voltage readings that I recorded ranged from 0-1.9V and so the digital voltmeter with a range of 0-5V was the most ideal one to use. I recorded 3 sets of voltage readings and decided to take an average voltage reading for each length to ensure a greater accuracy in the obtained results and in the plotted graph.
Length of the wire: - At the beginning when I did a preliminary experiment I was using crocodile clips instead of terminal blocks to connect the wire to the circuit. Although the crocodile clips made it easier for me to measure the length of the wire however I found it very difficult to keep the wires in these clips since it kept slipping out so the wire wouldn't get connected successfully to the circuit. I therefore decided to use terminal blocks because even though these blocks make it more difficult for the wire to be measured accurately using a meter ruler, this can be overcome by using large wire lengths so that the inaccuracy in measuring its length will become very tiny and so can be neglected. I decided to chose 8 different lengths between 30-100cm because when I did a preliminary experiment I found that these lengths gave accurate results and that 8 readings was sufficient enough for me to plot a st. line graph and draw a good line of best fit through the points.
Micrometer screw-gauge: - I decided to measure the diameter of the wire at 3 different positions on the wire. I then calculated the average diameter from the 3 measurements taken to enable me to measure the diameter of the wire as accurately as possible.
GCSE Physics Resistance of a Wire
Before starting my coursework I have decided to chose a factor that will affect the resistance of a wire.
I shall do this by going through all of the factors that affect the resistance of a wire and how I would
measuring each factor to find out which would be the most effective and easiest factor to measure.
Below is a list of factors and reasons why they affect the resistance of a wire. From this list of factors I
shall only pick one factor to investigate. To explain the how the factors would affect the resistance of a
wire I have drawn a diagram to show how resistance occurs.
WIRE
ATOMS=
ELECTRONS=
Resistance occurs when the electrons travelling along the wire collide with the atoms of the wire.
These collisions slow down the flow of electrons causing resistance. Resistance is a measure of how
hard it is to move the electrons through the wire.
Factors
.Temperature: If the wire is heated up the atoms in the wire will start to vibrate because of their
increase in energy. This causes more collisions between the electrons and the atoms as
the atoms are moving into the path of the electrons. This increase in collisions means that
there will be an increase in resistance.
2.Material : The type of material will affect the amount of free electrons which are able to flow through
the wire. The number of electrons depends on the amount of electrons in the outer energy
shell of the atoms , so if there are more or larger atoms then there must be more electrons
available. If the material has a high number of atoms there will be high number of electrons
causing a lower resistance because of the increase in the number of electrons. Also if the
atoms in the material are closely packed then the electrons will have more frequent collisions
and the resistance will increase.
3.Wire length : If the length of the wire is increased then the resistance will also increase as the
electrons will have a longer distance to travel and so more collisions will occur. Due to this
the length increase should be proportional to the resistance increase.
4.Wire width : If the wires width is increased the resistance will decrease. This is because of the
increase in the space for the electrons to travel through. Due to this increased space between
the atoms there should be less collisions.
To chose which factor I am going to investigate I am going to consider how I would measure each
factor and which factor would be the best and easiest to record.
To measure the wire width I would use different widths of the same length and same material of wire
e.g. thin , medium and thick copper wire with thin and thick constantin wire. To record the difference
in widths I would use the same voltage and measure the resistance for each thickness. Although it
would be easy to obtain and record the data the graphs that I would be able to draw up would not be
interesting.
For the temperature of the wire I would not be able to carry out a fair test because it is extremely
difficult to produce and control the range of temperatures needed without the correct equipment.
If I chose to measure the difference in the resistance in different materials I would chose a number of
different materials and using the same voltage I would record the resistance given by each wire of the
same length and width. Although once again it would be simple to record these results the graphs that
could be drawn would not show any connection between the material and the resistance because of the
limited number of materials I could test with the equipment available.
The final factor is the length of the wire. To measure and record the findings for this factor would be
simple and the results collected could show a connection between the length of the wire and the
resistance given by the wire. This is why I have chosen to investigate this factor.
Prediction
I predict that if the length increases then the resistance will also increase in proportion to the length. I
think this because the longer the wire the more atoms and so the more likely the electrons are going to
collide with the atoms. So if the length is doubled the resistance should also double. This is because if
the length is doubled the number of atoms will also double resulting in twice the number of
collisions slowing the electrons down and increasing the resistance. My graph should show that the
length is proportional to the resistance.
The diagrams below show my prediction and shhould explain it more clearly
Because the length of the wire is only half the length of the wire below there should be half the number
of collisions between the electrons and the atoms.
The wire below is twice the length of the wire above and so there should be twice the number of atoms
resulting in twice as many collisions and a predicted doubling of the resistance.
Preliminary Method
In this preliminary experiment I will select a wire that will be used in my main experiment when
investing the connecting between the length of the wire and the resistance of the wire.
To ensure a fair test whilst carrying out my preliminary experiments I am going to be very careful
when selecting my independent variables which are the width of the wire and the wire material. I am
going to use a constant voltage of 2 volts and a constant length of 50 cm.
Apparatus: Meter ruler ¡V To measure the wire being tested to ensure a fair test.
Selection of wires ¡V Different materials and widths but the same length.
Crocodile clips ¡V To connect the wire being investigated to the rest of the circuit.
Voltmeter & Ammeter ¡V To measure the resistance.
Wires ¡V To connect the above items and to complete the circuit.
To measure the resistance of the wire I am going to use the equation RESISTANCE=VOLTS
CURRENT I will obtain the voltage and current readings from the voltmeter and ammeter. ...
This is a preview of the whole essay
Apparatus: Meter ruler ¡V To measure the wire being tested to ensure a fair test.
Selection of wires ¡V Different materials and widths but the same length.
Crocodile clips ¡V To connect the wire being investigated to the rest of the circuit.
Voltmeter & Ammeter ¡V To measure the resistance.
Wires ¡V To connect the above items and to complete the circuit.
To measure the resistance of the wire I am going to use the equation RESISTANCE=VOLTS
CURRENT I will obtain the voltage and current readings from the voltmeter and ammeter.
Below is a circuit diagram for my preliminary experiment.
POWER SUPPLY
2 VOLTS
AMMETER
VOLTMETER
CROCODILE CLIPS
WIRE
METER RULER
To ensure a fair test I shall keep the power supply at 2 volts and I shall keep the length of the wire at 50
cm.
Preliminary Results
Below is a table of results which I have collected from my preliminary experiment.
WIRE VOLTS (v) AMPS (A) RESISTANCE (Ohms)
THICK COPPER 0.3 5.13 0.06
MEDIUM COPPER 0.6 4.20 0.14
THIN COPPER 0.9 3.13 0.29
STEEL 0.7 1.20 0.58
MEDIUM CONSTANTIN 1.0 0.41 2.44
THIN CONSTANTIN 2.7 0.49 5.51
From these results I have chosen to use thin constantin for the wire I am going to use in my main
experiment. I have chosen this wire as it has the highest resistance and so it will be easier to notice any
difference in resistance in my main experiment
Main Method
Before I start my main experiment I have chosen to do a risk assessment which is shown below.
Risk Assessment:
"h I will handle the power supply carefully.
"h I am going to only use a voltage of 2 volts.
"h I will be careful when handling live wires.
Apparatus: Power Supply
Ammeter
Voltmeter
Thin Constantin wire
Meter Ruler
Crocodile Clips
Connecting Wires
I have chosen to use thin constantin wire because from my preliminary results I found that this wire had the highest resistance, because it has the highest resistance it will be easier to measure any change in resistance.
To collect the data for my graph I have chosen to take a range of 5 lengths. I have chosen a range of 5
as to plot an accurate graph I will need at least 5 points to mark on the graph . I have also chosen to
take 3 repeats at each length and then take an average. I have chosen this so that if I have any
anomalous results they will not show when I plot the averages on the graph. The lengths that I have
chosen are as follows : 20cm , 40cm , 60cm , 80cm and 100cm. I have chosen these lengths because
they are easily measured by the meter ruler and give a good range.
Below is a circuit diagram of the circuit I am going to use in my main experiment:
POWER SUPPLY
2 VOLTS
AMMETER
VOLTMETER
CROCODILE CLIPS
WIRE
METER RULER
In my main experiment instead of using an ohmmeter I have chosen to use an ammeter and voltmeter ,
I have done this so that instead of relying on the ohmmeter to give the resistance I will calculate the
resistance of the wire , I shall calculate the resistance of the wire using the equation below.
RESISTANCE = VOLTS
AMPS
I have chosen to use a meter ruler because the lengths that I will be measuring are to big for a smaller
ruler and also the meter ruler can be accurate to +1mm or ¡V1mm.
Results
Below is a results table with the results that I collected from my main experiment.
LENGTH 200 mm 400 mm 600 mm 800 mm 1000 mm
VOLTS (v) 1.6 1.5 1.6 1.7 1.7 1.7 1.8 1.8 1.8 1.9
.8 1.8 1.9 1.9
.9
AMPS (I) 0.608 0.609 0.607 0.351 0.352 0.351 0.237 0.238 0.238 0.184 0.184 0.184 0.148 0.149 0.149
RESISTANCE
(Ohms) 2.6 2.5 2.6 4.8 4.8 4.8 7.6 7.6 7.6 10.3 9.8 9.8 12.8 12.8 12.8
AVERAGE
RESISTANCE
(Ohms)
2.6
4.8
7.6
0.0
2.8
From these results I have drawn a graph of the length of the wire and the resistance of the wire.
Analysis
From the graph on the previous page I can see that the resistance of the wire is proportional to the
length of the wire. I know this because the Line of Best Fit is a straight line showing that if the length of the wire is increased then the resistance of the wire will also increase.
Conclusion
In my prediction I said that :
¡§¡K.if the length increases than the resistance will also increase in proportion to the length.¡¨
From my graph I have shown that my prediction was correct, as the Line of Best Fit is a straight line proving that the resistance of the wire is proportional to the length of the wire.
The length of the wire affects the resistance of the wire because the number of atoms in the wire increases or decreases as the length of the wire increases or decreases in proportion.
The resistance of a wire depends on the number of collisions the electrons have with the atoms of the material , so if there is a larger number of atoms there will be a larger number of collisions which will increase the resistance of the wire. If a length of a wire contains a certain number of atoms when that length is increased the number of atoms will also increase. This is shown in my diagrams below:
Electron
Atom
In this diagram the wire is half the length of the wire below and so has half the number of atoms, this means that the electrons will collide with the atoms half the amount of times.
Also if the length of the wire was trebled or quadrupled then the resistance would also treble or quadruple.
Evaluation
From my results table and graph I can see that my results that I collected are very reliable. I know this because my results table does not show any individual anomalous results this means that I did not have to leave any results out of my averages because they were anomalous. Also on the graph I can see that none of the averages plotted are anomalous because all the averages lie along the same straight line.
During my experiment I have noticed several modifications I could make to improve on the Investigation if I was to repeat it.
The first of these modifications would be the circuit that I would use. To be more accurate with my results I would use the circuit layout below:
POWER SUPPLY
2 VOLTS
AMMETER
VOLTMETER
WIRE
METRE RULER
Instead of connecting the voltmeter to the main circuit I would connect it to the wire which is being tested. I would do this so that the voltmeter is measuring the voltage of just the wire being tested and not the wires of the main circuit as well.
To also improve on my results I would use a digital voltmeter instead of an analogue meter. I would do this because a digital voltmeter is a lot more accurate than an analogue because if the needle in the analogue voltmeter is bent then the readings given off will be false whereas a digital voltmeter does not rely on a needle or any other manual movements.
The next modification I would make would be to use pointers instead of crocodile clips, I would do this because pointers would be more accurate. The pointers would be more accurate because the tips have a much smaller area than the crocodile clips giving a more accurate measurement of the length of wire.
As well as making these modifications I would also improve my Investigation by testing the same wire but different widths of that wire. I would do this to expand on my Investigation.
current and resistance investigation
Aim:
Investigate how the length of a wire affects the current and resistance of a wire.
Prediction and Hypothesis:
I think as you increase the length of the Constatan wire, you also increase the amount of resistance. The current is the flow of electrons; the current is dependent on the amount of voltage, which is applied. Voltage is the push given to the current. The current has to go through a circuit, which contains resistance so if you increase that push you also increase the flow of the current. All materials have a slight resistance to electricity factors affecting the resistance are: Length, Voltage & Temperature and Surface Area
Length
The diagram shows the happenings of a wire
the blue dots represent some of the negative
electrons which leads to a lower voltage output,
when the length is increased.
Voltage & Temperature
Temperature has an affect on the experiment as the voltage has control over the temperature. The more the temperature increases the more the particles vibrate leading to a reduction in output voltage although not by a huge amount this does have an affect.
Density
Density has a large affect on the amount of resistance. The resistance depends upon the amount of denseness e.g. a large surface area has less resistance because a small area has tightly packed atoms which in turn rebound many of these electrons.
Apparatus:
· Power Pack
· Constatan wire
· Leads
· Voltmeter
· Ammeter
Method:
. Arrange apparatus as shown in the Diagram:
2. Cut wires to the following lengths:
· 30cm
· 60cm
· 90cm
· 120cm
· 150cm
3. Attach the wire to the crocodile-clip leads and set voltage to 5 volts or 1.5 Volts
4. Take the reading from the ammeter and record in results table.
5. Repeat 4 times for each length of wire and find the average.
6. Then work out the resistance using the formula V÷I=R
(Voltage ÷ Current = Resistance)
Preliminary Experiment
We carried out a preliminary experiment to see the other factors that could affect the experiment and also to see if we could improve any of the steps in the method. This showed that the wire was very weak if given more than 5 volts because the wire lets electricity flow faster and faster which then leads to the heat eventually breaking the wire. I found that if I decreased the voltage to a reading of 1.5 volts the wire stayed in tact enough to give a good reading and thereby giving better overall results.
Voltage used 5 Volts
Length Current (1) Current (2) Current (3) Current (4) Average Resistance
30cm 4.4 4.6 4.6 4.7 4.5 1.1
60cm 2.3 2.4 2.2 2.5 2.4 2.1
90cm 1.8 1.7 1.7 1.9 1.8 2.8
20cm 1.6 1.5 1.5 1.6 1.5 3.3
50cm 1.2 1.2 1.3 1.3 1.25 4
Voltage used 5 Volts
Length Current (1) Current (2) Current (3) Current (4) Average Resistance
30cm 4.2 4.6 4.3 4.4 4.4 1.1
60cm 3.3 3.2 3.1 3.1 3.2 1.6
90cm 2.1 2.4 2.2 2.2 2.5 2
20cm 1.7 1.8 1.6 1.6 1.7 2.9
50cm 1.3 1.2 1.4 1.4 1.3 3.8
The two tables above show the results given in the preliminary experiments they both seemed to heat up the wire to a substantial heat proven by the red glow on the 30cm wire (occasionally). The results obtained below show a much better picture of the happenings in the experiment.
Results
Voltage used 1.5 Volts
Length Current (1) Current (2) Current (3) Current (4) Average Resistance
30cm 1.7 1.6 1.8 1.7 1.7 0.9
60cm 0.9 1.0 1.1 1.0 1.0 1.5
90cm 0.5 0.6 0.6 0.6 0.6 2.5
20cm 0.4 0.5 0.4 0.4 0.4 3.8
50cm 0.3 0.5 0.4 0.4 0.4 3.8
The results above were the final results after the improvements made on the preliminary experiment.
Conclusion
I came to a conclusion that the decrease in current is the increase in resistance this is because the current although less of it they collide with the resistance causing a decrease in the output voltage.
Evaluation
The experiment proved to be a success and it went very well although it could be improved by trying other lengths, different voltages but also a different type of wire to be able to compare the resistance difference this would make a more interesting experiment.
Factors Affecting the Ressistance of a wire
The Task of this investigation is to find out the factors that affect the resistance of a variety of electrical conductors.
This will be done by performing experiments that try and investigate different proposed factors and to see whether they affect the resistance.
There are many factors that are known to affect the resistance of an object; it is determined by the nature of the substance of which it is composed, known as the resistivity, the dimensions of the object, and the temperature. The dimensions of the object include the surface area of the wire conductor and the length of the conductor. The factors that can be investigated in Physics are those known as quantitative results or those that have continuos data such as length. The Factors that I will be investigating will be the type of material, the surface area of the wire and the length. The reason temperature is not being investigated is that it is a difficult factor to measure because it Is hard to measure the temperature within a wire. Temperature affects the wire so that the experiment does not become fair. To eliminate this we must perform a preliminary experiment to show what is the range of readings we must perform the experiment within; this range will be so that it does not be affected by heat.
Knowledge that I already have is Ohms law and how to measure resistance using a voltmeter and an ammeter. Ohm's law states that the amount of current flowing in a circuit made up of pure resistances is directly proportional to the electromotive force impressed on the circuit and inversely proportional to the total resistance of the circuit. The law is usually expressed by the formula I = E/R, where I is the current in amperes, E is the electromotive force in volts, and R is the resistance in ohms. This enables us to work out the resistance using the current and Voltage.
R=V/I.
The other piece of background knowledge is to measure resistance in a circuit using a voltmeter and ammeter. This is done by: V/I=Resistance
In this experiment I expect that, as there are three different wires to be investigated when it comes to Material of the conductor. These are constantan, Copper, Nickel Chromium and Manganese. These are used as wires in industry for some of their characteristics such as high conductivity (Copper, which is also very ductile) and the wires can be as small as to have a diameter of 0.025mm. I expect that the longer the wire is the more the resistance, I also think that the resistance is directly proportional to the length. This prediction is backed up by the fact that when there is a long wire, the electricity has to travel and further distance and therefore collides with many more protons as it passes through and may be slowed down because the electrons have been deflected. My Prediction is that the length of the wire will be directly proportional to the resistance of the wire. I also expect the cross section also to be directly proportional to the resistance of the wire. I think that according to each individual wire, the resistance will be different, to gain a helpful prediction, some more background information must be achieved.
As the red electrons travel from the negative end to the positive end, they are attracted by the opposite force Protons (blue) with then the electrons collide with and then continue the journey, The Protons are also vibrating, as the heat increases so does the amount of vibration of the protons. I think that as the surface area of a wire increases so does the resistance. This is because of the same reason that there are more Protons to collide with. Some metals have different resistances, this means that some metals such as copper are excellent conductors whilst other such as plastic are terrible.
I will make this experiment fair by performing investigation on each variable one at a time as not to get the variable mixed up. For a suitable set of results I will investigate how the different materials affect the resistance, in this experiment I shall have wire of the same length, surface are but I will have 4 different materials. For the length and surface area, I shall keep all other variable the same except of those that I am investigating. I shall also have to control the temperature in order to stop it from interfering with the investigation and changing the resistance. How I will perform the experiment is by, taking a wire of a certain Gauge and of 50 cm length (keeping all variables except the variable being investigated constant) Then use the power supply, voltmeter, ammeter, crocodile clips, wires and measuring devices (ruler). With these instruments, I will set up the diagram shown. After performing a preliminary experiment using a piece of wire and connecting the circuit together, I will see the power supply that is best suited for the experiment. After performing this experiment, after many wires had burnt, I decided that the best reading would be 4 volts.
I will take as many different measurements as possible so that there can be a good spread of results so that I am able to arrive at a good conclusion. To increase the accuracy of my results I will perform repeats for all my experiments so that the average will make a highly accurate results table.
Here are some examples tables for the Length factor:
Constantan:
Length of Wire: cm Voltmeter Reading: Volts Ammeter Reading: amps Resistance: ohms
5
0
5
20
25
30
35
40
45
50
This will investigate the value of varying the length of the wire. The repeat results will be produced in a graph similar to this.
I will need a ruler, different metals and an instrument to measure the surface area of the wire. I will also need a voltmeter and an ammeter.
The equipment will be set up in the following manner as shown in the circuit diagram so that I can measure the voltage readings and ammeter readings for each length and wire. I will vary the Wire by placing a crocodile clip at different lengths down the wire in order to vary the lengths.
I will use the results of the investigation to answer the question by placing the results into a chart and then transferring the information onto a graph so that is easy to interpret. We can see that if my prediction was correct because we can see that there is a direct proportionality between the factors and the resistance.
Other work and preliminary work that I have done that will help me in this experiment is that
How the length of a wire changes the resistance
The resistance of a wire depends on certain factors. Investigate the effect of two of these factors - Planning
Some variables that will be relevant to this investigation are:
* Length
* Thickness
* Temperature
* Voltage
* Resistance
* Material
Of these the variables will be input and output voltages in experiment one, and length and resistance in experiment two. The other variables (temperature, material and voltage) will have to be kept constant in both experiments to make sure that only length, thickness and resistance are investigated. In experiment 1 the same bit of wire and the same thickness need to be kept constant. In experiment 2, the length will need to be kept constant to make sure only the variables indicated are investigated to ensure a fair test.
Metals conduct electricity because the atoms in them do not hold on to their electrons very well, and so creating free electrons, carrying a negative charge to jump along the line of atoms in a wire. Resistance is caused when these electrons flowing towards the positive terminal have to 'jumps' atoms. So if we double the length of a wire, the number of atoms in the wire doubles, so the number of jumps double, so twice the amount of energy is required: There are twice as many jumps if the wire is twice as long.
The thinner the wire is the less channels of electrons in the wire for current to flow, so the energy is not spread out as much, so the resistance will be higher: We see that if the area of the wire doubles, so does the number of possible routes for the current to flow down, therefore the energy is twice as spread out, so resistance might halve,
i.e. Resistance= 1/Area.
This can be explained using the formula
R = V/I
where there is 2X the current, and the voltage is the same, therefore R will halve. I did some research and in a book called 'Ordinary Level Physics' By A. F. Abbott, it says 'that doubling the area will therefore halve the resistance'- in other words the resistance of a wire is inversely proportional to its area, or R ? 1/A , but we are measuring diameter, so if the area is: ?r2 = ?(d?2) 2 A= ?d2 ? 4 Where A is area and d is diameter.
Method
Experiment One - First a length of wire over a metre long is sellotaped to a metre rule. The positive crocodile clip is attached at 0cm. And the negative is moved up and down the wire, stopping at 20, 40, 60, 80 and 100cm. Each time reading the ammeter and voltmeter to work out resistance R = V/I. This is using 30 SWG wire. Other variables, voltage, thickness, and temperature will be kept constant, although the temperature will rise once current is passing through it, which will cause the atoms in the wire to vibrate, and so obstruct the flow of electrons, so the resistance will increase, creating an error.
In both experiments constantan wire is used because it does not heat up as much as copper, so the resistance is not effected as much.
Experiment Two - The circuit is set up is the same, as is the method apart from the length is constant at 50cm, and the thickness is changed between 28, 30, 32, 34, 36, 38 and 40 swg. For both experiments the voltage will be kept the same at 2V dc from a power pack. Both experiments will be done twice with different ammeters in case of any damaged or old equipment to gain more accurate results.
Results
Experiment 1
Length (cm) V1 (volts) V2 (volts) A1 (amps) A2 (amps) Average resistance (Ohms)
00 1.00 1.00 0.20 0.20 5.00
80 1.00 1.00 0.30 0.28 4.00
60 0.90 0.90 0.40 0.30 2.80
40 0.90 0.85 0.50 0.40 1.94
20 0.70 0.80 0.80 0.75 0.94
Experiment 2
Thickness (mm) Area (mm2) V1 (volts) V2 (volts) A1 (amps) A2 (amps) Resistance
28 0.36 0.107 0.8 0.8 0.61 0.59
.3 0.29 0.066 0.9 0.9 0.49 0.51
.8 0.32 0.25 0.049 0.9 0.9 0.35
0.4 0.24 0.34 0.18 0.025 1.0 1.0
0.25 0.25 1.0 1.0 0.25 0.4 0.36
0.16 0.020 1.0 1.0 0.16 0.17 0.61
0.38 0.12 0.011 1.1 1.1 0.09 1.00
0.09 1.00 11.6 40 0.05 0.0020 1.2
Analysis
The graph of experiment 1 is a straight line through the origin, which means R is directly proportional to L. This means that if the length is 40cm, and resistance is 2?, then if length is doubled to 80cm, resistance also doubles to 4.
This is because of the scientific idea, stated in the planning that if you double length, you double the number of atoms in it, so doubling the number of electron 'jumps', which causes resistance: The results support my predictions well, the results turned out the way I had expected, they match the predicted line well. I had predicted a straight line through the origin, which means R is directly proportional to L.
The graph of experiment 2 is an inversely proportional curve. This is because R is directly proportional 1/A, this means when A doubles, R halves. for example when the Area is 0.025mm2 the resistance is 4.8. When A doubles to 0.05, R halves to 2.4?. When A doubles again, R halves again to 1.2. This is because, as stated earlier: We see that if the area of the wire doubles, so does the number of possible routes for the current to flow down, therefore the energy is twice as spread out, so resistance might halve, i.e. Resistance is directly proportional 1/Area.
This can be explained using the formula R = V/I, where there is 2X the current, and the voltage is the same, therefore R will halve.
Evaluation
Evaluation Experiment one: This experiment was quite accurate, as when it is compared to the manufactures line which is on the same graph, we can see that this line is at most only 0.4? different form the manufactures line. This is a percentage difference of approximately 8%, using the formula: Difference ? original X 100 This shows that the results were good, as 8% is a very small margin of error. The error bars on the graph show that the most inaccurate result was the 60cm result. This could be down to an error in the measurement of the wire or a temperature rise. The two results for 100cm are exactly the same, and it is near to the manufacture's line, so this is the most accurate point.
The other three readings have almost the same inaccuracy, an average of 10%, which again, is fairly accurate. The inaccuracy could have been because of the wire coming from a different manufacturer to the predicted results, as there is some discrepancy between the amount of copper and nickel in different brand's wire. The ammeters and voltmeters could have been damaged and reading falsely on both the meters used.
Measuring the lengths of the wire is also a inaccuracy as the rulers used are not exact, and it is difficult to get an accurate reading of length by eye, as the wire might not be completely straight, it may be of different thicknesses throughout the length. These would have contributed as well to the error. These results would be difficult to improve on as they are reasonably accurate, and there were no anomalous results. But if I were to do this experiment again, I would use newer, more accurate ammeters and voltmeters, a more accurate method of measurement, and take a much wider range of readings, and more readings so that a more accurate average can be taken.
I would also investigate other factors, such as temperature, voltage and current, and see how these effect the resistance. I would also do the experiments under different conditions such as temperature and pressure to see if it makes any difference to resistance. As these results had a range of only 5 readings, from 0-100cm, and were only repeated twice, and that the results are not 100%, accurate due to the errors discussed earlier, then I would say that these results are not strong enough to base a firm conclusion on because there are so many sources of error, which are explained earlier.
Experiment two - These results were not as accurate as experiment one. I had predicted that the resistance should halve as area doubles, which it does, however not to the predicted curve. When the resistance is 24ohms, the % inaccuracy is 6%, and when the resistance is 6 ohms, the inaccuracy is 8%. These inaccuracies are fairly large. The error bars, however, are too small to be drawn accurately on the graph. They are at most 3% inaccurate, using the same formula as before. This suggests that the inaccuracies were not experimental, but permanent errors due to problems with the measuring equipment.
These results were this inaccurate as the tool used for measuring the diameter of the wire were very inaccurate due to a zero error on the screw reading, i.e. the mark given for zero mm was not the real mark, hence throwing all the results off by the same amount. The ammeters and voltmeters could have been damaged and reading falsely on both the meters used. Measuring the lengths of the wire is also a inaccuracy as the rulers used are not exact, and it is difficult to get an accurate reading of length by eye, as the wire might not be completely straight, it may be of different thicknesses throughout the length. These would have contributed as well to the error.
There was one slightly anomalous result, at 0.25mm2. This could have been due to a unique error in the measuring and or reading of the meters, or a temperature change. These results could be done better. If I were to do this experiment again, I would use newer, more accurate ammeters and voltmeters, a more accurate method of measurement, and take a much wider range of readings, and more readings so that a more accurate average can be taken. I would also investigate other factors, such as temperature, voltage and current, and see how these effect the resistance. I would also do the experiments under different conditions such as temperature and pressure to see if it makes any difference to resistance.
As these results had a range of only 7 readings, from 0.1mm2, and were only repeated twice, and that the results are not 100% accurate, due to the errors discussed earlier, then I would say that these results are not strong enough to base a firm conclusion on because there are so many sources of error, which have been explained earlier.
Investigating the resistance of a wire
Alex Graves 14/09/00
Preliminary Experiment
Equipment
. Electric Wires
2. Crocodile clips
3. Metallic conductive wires (6 different types of wires cut at 50 cm)
4. Voltmeter
5. Ammeter
6. Power pack
The apparatus was set as shown above. We took two results, from each wire, as well as taking the current from each wire and the voltage. Each wire was measured at 50cm, then tested at 5cm and 50 cm.
We made sure that the experiment would be safe, by cooling the wire by blowing on it when it got hot, and by not touching it, so that we would not burn ourselves.
We selected an ammeter, voltmeter, power pack and electric wire in order to take the voltage and current in order to figure out the resistance of the wire so that we could tell which wire was the most accurate for the experiment.
Throughout the experiment, we made sure that we kept it as fair as possible. We kept the room temperature constant, we made sure that the wire did not heat up and we kept the voltage on the power pack constant.
Two results were taken per wire, one with the wire at 50cm and the other at 5cm. The results included the Voltage and the Current of each length of each wire.
We then each converted our results to find the resistance running through the wire. In doing this we used the equation V = IR, where V is the voltage, I being the current and R the resistance. In the case of our results, we had to use the formulae R = V divided by I
Preliminary Research
Conductivity of metals.
Metals have a high density of conduction electrons. The aluminium atom has three valence electrons in a partially filled outer shell. In metallic aluminium the three valence electrons per atom become conduction electrons. The number of conduction electrons is constant, depending on neither temperature nor impurities. Metals conduct electricity at all temperatures, but for most metals the conductivity is best at low temperatures.
Resistance in electricity, property of an electric circuit or part of a circuit that transforms electric energy into heat energy in opposing electric current. Resistance involves collisions of the current-carrying charged particles with fixed particles that make up the structure of the conductors. Resistance is often considered as localised in such devices as lamps, heaters, and resistors, in which it predominates, although it is characteristic of every part of a circuit, including connecting wires and electric transmission lines.
The spread of electric energy in the form of heat, even though small, affects the amount of electromotive force, or driving voltage, required to produce a given current through the circuit. In fact, the electromotive force V (measured in volts) across a circuit divided by the current I (amperes) through that circuit defines quantitatively the amount of electrical resistance R. Precisely, R = V/I. Thus, if a 12-volt battery steadily drives a 2-ampere current through a length of wire, the wire has a resistance of 6 volts per ampere, or 6 ohms. Ohm is the common unit of electrical resistance, equivalent to one volt per ampere and represented by the capital Greek letter omega, . The resistance of a wire is directly proportional to its length and inversely proportional to its cross-sectional area. Resistance also depends on the material of the conductor.
The resistance of a conductor, or circuit element, generally increases with increasing temperature. When cooled to extremely low temperatures, some conductors have zero resistance. Currents continue to flow in these substances, called superconductors, after removal of the applied electromotive force.
The reason that the length is proportional to the resistance is to do with free electrons. The free electrons constantly flow around the circuit, as fast as they can. The ions in the circuit though, get in their way, and the electrons and ions collide causing resistance. This is what causes resistance. By increasing the length of the wire, we are adding more ions to the circuit therefore increasing the chance that they will collide.
Analysis and relation to experiment
According to my research, The resistance of a wire generally increases as the temperature of the wire increases. This means that if the heat of the wire does increase, than the results we be inaccurate and therefore the experiment will have to be repeated. That is why it is essential to keep the wire at a constant.
It also tells us that the resistance of a wire is directly proportional to its length and that the resistance depends on the material of the conductor. That is why it is we have used several wires - to see which one was most accurate to our scientific prediction.
I will take two readings for each wire to decide which wire is the most useful for me. The difference between the two should be proportional according to my scientific knowledge.
I predict that as the length increases, so does the resistance. I also predict that they will be proportional to one another, and that each 50cm reading shall be ten times bigger than each 5cm reading.
Wire Length Pd (volts) Current (amps) Resistance ( Ohms)
Copper 32 5cm 0.04 1.04 0.038
50cm 0.1 0.67 0.149
Copper 36 5cm 0.11 1.12 0.098
50cm 0.28 0.78 0.359
Constantine 24 5cm 0.17 0.92 0.185
50cm 0.56 0.53 1.057
Constantine 28 5cm 0.21 0.86 0.244
50cm 0.89 0.35 2.543
Constantine 32 5cm 0.27 0.73 0.370
50cm 1.06 0.25 4.240
Constantine 34 5cm 0.48 0.57 0.842
50cm 0.53 0.58 0.914
Analysis of results
I have decided that:
Copper 32 is too small in order for the voltage and the current to be measured accurately.
The same thing applies for copper 36 although the case is not as bad. Also I am not able to use these two wires, as they do not follow the rule that the resistance is directly proportional to the length.
Constantine 24 is quite good although I suspect it may have heated up in the process of the experiment.
Constantine 28 seems almost perfect to me, as the figures are relatively easy to measure, and the resistance for 50 cm is ten times larger than the resistance, roughly, so I cannot fault it.
Constantine 32 also seems to be all right in terms of the relationship between length and resistance.
Constantine 34 however seems as though there is very little difference in terms of the length. This may have been due to a change in temperature.
length of wire
"GCSE Physics Resistance of a Wire"
Extended Title: "Investigation of factors that affect resistance of a wire"
Before starting my coursework I have decided to chose a factor that will affect the resistance of a wire.
I shall do this by going through all of the factors that affect the resistance of a wire and how I would
measuring each factor to find out which would be the most effective and easiest factor to measure.
Below is a list of factors and reasons why they affect the resistance of a wire. From this list of factors I
shall only pick one factor to investigate. To explain the how the factors would affect the resistance of a
wire I have drawn a diagram to show how resistance occurs.
WIRE
ATOMS=
ELECTRONS=
Resistance occurs when the electrons travelling along the wire collide with the atoms of the wire.
These collisions slow down the flow of electrons causing resistance. Resistance is a measure of how
hard it is to move the electrons through the wire.
Factors
.Temperature : If the wire is heated up the atoms in the wire will start to vibrate because of their
increase in energy. This causes more collisions between the electrons and the atoms as
the atoms are moving into the path of the electrons. This increase in collisions means that
there will be an increase in resistance.
2.Material : The type of material will affect the amount of free electrons which are able to flow through
the wire. The number of electrons depends on the amount of electrons in the outer energy
shell of the atoms , so if there are more or larger atoms then there must be more electrons
available. If the material has a high number of atoms there will be high number of electrons
causing a lower resistance because of the increase in the number of electrons. Also if the
atoms in the material are closely packed then the electrons will have more frequent collisions
and the resistance will increase.
3.Wire length : If the length of the wire is increased then the resistance will also increase as the
electrons will have a longer distance to travel and so more collisions will occur. Due to this
the length increase should be proportional to the resistance increase.
4.Wire width : If the wires width is increased the resistance will decrease. This is because of the
increase in the space for the electrons to travel through. Due to this increased space between
the atoms there should be less collisions.
To chose which factor I am going to investigate I am going to consider how I would measure each
factor and which factor would be the best and easiest to record.
To measure the wire width I would use different widths of the same length and same material of wire
e.g. thin , medium and thick copper wire with thin and thick constantin wire. To record the difference
in widths I would use the same voltage and measure the resistance for each thickness. Although it
would be easy to obtain and record the data the graphs that I would be able to draw up would not be
interesting.
For the temperature of the wire I would not be able to carry out a fair test because it is extremely
difficult to produce and control the range of temperatures needed without the correct equipment.
If I chose to measure the difference in the resistance in different materials I would chose a number of
different materials and using the same voltage I would record the resistance given by each wire of the
same length and width. Although once again it would be simple to record these results the graphs that
could be drawn would not show any connection between the material and the resistance because of the
limited number of materials I could test with the equipment available.
The final factor is the length of the wire. To measure and record the findings for this factor would be
simple and the results collected could show a connection between the length of the wire and the
resistance given by the wire. This is why I have chosen to investigate this factor.
Prediction
I predict that if the length increases then the resistance will also increase in proportion to the length. I
think this because the longer the wire the more atoms and so the more likely the electrons are going to
collide with the atoms. So if the length is doubled the resistance should also double. This is because if
the length is doubled the number of atoms will also double resulting in twice the number of
collisions slowing the electrons down and increasing the resistance. My graph should show that the
length is proportional to the resistance.
The diagrams below show my prediction and should explain it more clearly:
Because the length of the wire is only half the length of the wire below there should be half the number
of collisions between the electrons and the atoms.
The wire below is twice the length of the wire above and so there should be twice the number of atoms
resulting in twice as many collisions and a predicted doubling of the resistance.
Preliminary Method
In this preliminary experiment I will select a wire that will be used in my main experiment when
investing the connecting between the length of the wire and the resistance of the wire.
To ensure a fair test whilst carrying out my preliminary experiments I am going to be very careful
when selecting my independent variables which are the width of the wire and the wire material. I am
going to use a constant voltage of 2 volts and a constant length of 50 cm.
Apparatus: Meter ruler ¡V To measure the wire being tested to ensure a fair test.
Selection of wires ¡V Different materials and widths but the same length.
Crocodile clips ¡V To connect the wire being investigated to the rest of the circuit.
Voltmeter & Ammeter ¡V To measure the resistance.
Wires ¡V To connect the above items and to complete the circuit.
To measure the resistance of the wire I am going to use the equation RESISTANCE=VOLTS
CURRENT I will obtain the voltage and current readings from the voltmeter and ammeter.
Below is a circuit diagram for my preliminary experiment.
POWER SUPPLY
2 VOLTS
AMMETER
VOLTMETER
CROCODILE CLIPS
WIRE
METER RULER
To ensure a fair test I shall keep the power supply at 2 volts and I shall keep the length of the wire at 50cm.
Preliminary Results
Below is a table of results which I have collected from my preliminary experiment.
WIRE VOLTS (v) AMPS (A) RESISTANCE (Ohms)
THICK COPPER 0.3 5.13 0.06
MEDIUM COPPER 0.6 4.20 0.14
THIN COPPER 0.9 3.13 0.29
STEEL 0.7 1.20 0.58
MEDIUM CONSTANTIN 1.0 0.41 2.44
THIN CONSTANTIN 2.7 0.49 5.51
From these results I have chosen to use thin constantin for the wire I am going to use in my main
experiment. I have chosen this wire as it has the highest resistance and so it will be easier to notice any
difference in resistance in my main experiment
Main Method
Before I start my main experiment I have chosen to do a risk assessment which is shown below.
Risk Assessment:
"h I will handle the power supply carefully.
"h I am going to only use a voltage of 2 volts.
"h I will be careful when handling live wires.
Apparatus: Power Supply
Ammeter
Voltmeter
Thin Constantin wire
Meter Ruler
Crocodile Clips
Connecting Wires
I have chosen to use thin constantin wire because from my preliminary results I found that this wire had the highest resistance, because it has the highest resistance it will be easier to measure any change in resistance.
To collect the data for my graph I have chosen to take a range of 5 lengths. I have chosen a range of 5
as to plot an accurate graph I will need at least 5 points to mark on the graph . I have also chosen to
take 3 repeats at each length and then take an average. I have chosen this so that if I have any
anomalous results they will not show when I plot the averages on the graph. The lengths that I have
chosen are as follows : 20cm , 40cm , 60cm , 80cm and 100cm. I have chosen these lengths because
they are easily measured by the meter ruler and give a good range.
Below is a circuit diagram of the circuit I am going to use in my main experiment:
POWER SUPPLY
2 VOLTS
AMMETER
VOLTMETER
CROCODILE CLIPS
WIRE
METER RULER
In my main experiment instead of using an ohmmeter I have chosen to use an ammeter and voltmeter ,
I have done this so that instead of relying on the ohmmeter to give the resistance I will calculate the
resistance of the wire , I shall calculate the resistance of the wire using the equation below.
RESISTANCE = VOLTS
AMPS
I have chosen to use a meter ruler because the lengths that I will be measuring are to big for a smaller
ruler and also the meter ruler can be accurate to +1mm or ¡V1mm.
Results
Below is a results table with the results that I collected from my main experiment.
LENGTH 200 mm 400 mm 600 mm 800 mm 1000 mm
VOLTS (v) 1.6 1.5 1.6 1.7 1.7 1.7 1.8 1.8 1.8 1.9
.8 1.8 1.9 1.9
.9
AMPS (I) 0.608 0.609 0.607 0.351 0.352 0.351 0.237 0.238 0.238 0.184 0.184 0.184 0.148 0.149 0.149
RESISTANCE
(Ohms) 2.6 2.5 2.6 4.8 4.8 4.8 7.6 7.6 7.6 10.3 9.8 9.8 12.8 12.8 12.8
AVERAGE
RESISTANCE
(Ohms)
2.6
4.8
7.6
0.0
2.8
From these results I have drawn a graph of the length of the wire and the resistance of the wire.
Analysis
From the graph on the previous page I can see that the resistance of the wire is proportional to the
length of the wire. I know this because the Line of Best Fit is a straight line showing that if the length of the wire is increased then the resistance of the wire will also increase.
Conclusion
In my prediction I said that :
¡§¡K.if the length increases than the resistance will also increase in proportion to the length.¡¨
From my graph I have shown that my prediction was correct, as the Line of Best Fit is a straight line proving that the resistance of the wire is proportional to the length of the wire.
The length of the wire affects the resistance of the wire because the number of atoms in the wire increases or decreases as the length of the wire increases or decreases in proportion.
The resistance of a wire depends on the number of collisions the electrons have with the atoms of the material , so if there is a larger number of atoms there will be a larger number of collisions which will increase the resistance of the wire. If a length of a wire contains a certain number of atoms when that length is increased the number of atoms will also increase. This is shown in my diagrams below:
Electron
Atom
In this diagram the wire is half the length of the wire below and so has half the number of atoms, this means that the electrons will collide with the atoms half the amount of times.
Also if the length of the wire was trebled or quadrupled then the resistance would also treble or quadruple.
Evaluation
From my results table and graph I can see that my results that I collected are very reliable. I know this because my results table does not show any individual anomalous results this means that I did not have to leave any results out of my averages because they were anomalous. Also on the graph I can see that none of the averages plotted are anomalous because all the averages lie along the same straight line.
During my experiment I have noticed several modifications I could make to improve on the Investigation if I was to repeat it.
The first of these modifications would be the circuit that I would use. To be more accurate with my results I would use the circuit layout below:
POWER SUPPLY
2 VOLTS
AMMETER
VOLTMETER
WIRE
METRE RULER
Instead of connecting the voltmeter to the main circuit I would connect it to the wire which is being tested. I would do this so that the voltmeter is measuring the voltage of just the wire being tested and not the wires of the main circuit as well.
To also improve on my results I would use a digital voltmeter instead of an analogue meter. I would do this because a digital voltmeter is a lot more accurate than an analogue because if the needle in the analogue voltmeter is bent then the readings given off will be false whereas a digital voltmeter does not rely on a needle or any other manual movements.
The next modification I would make would be to use pointers instead of crocodile clips , I would do this because pointers would be more accurate. The pointers would be more accurate because the tips have a much smaller area than the crocodile clips giving a more accurate measurement of the length of wire.
As well as making these modifications I would also improve my Investigation by testing the same wire but different widths of that wire. I would do this to expand on my Investigation.