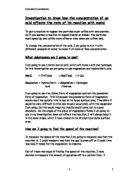
Apparatus
Conical Flask Hydrochloric acid
Picture of a black X Stop Clock
3 Measuring Cylinders Water
Beaker Goggles
Sodium Thiosulphate
Diagram Sodium Thiosulphate Hydrochloric acid
X (underneath the Conical Flask)
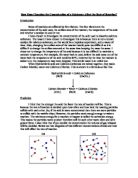
Method
-
Measure out 20mm of Sodium Thiosulphate and 20mm of Hydrochloric Acid (GOGGLES MUST BE WORN) in the measuring cylinders.
- Pour both the Sodium Thiosulphate and Hydrochloric acid in the Conical flask one after another and start timing straight away.
- Watch into the Conical flask and as soon as the ‘X’ can no longer be seen and stop the timer. Record your time.
- Now repeat the experiment but instead of putting 20mm of each solution in the beaker use 15mm of each solution and make up the 10mm of solution with water. Use this step over and over decreasing the amount of solution each time (e.g. 10mm Hydrochloric acid and 10mm Sodium Thiosulphate. The last 20mm should be water).
Results
1st Results
2nd Results
Graph can be found at the back of the project.
Conclusion
I conclude that the more diluted the solution is the longer the reaction time is. This is because the two substances that are added together in a lot of water can’t collide because they are more spread out. After looking over my results I can safely say that it all links into the collision theory, the more dilute the substance is the longer the reaction takes.
My graph is a good way of showing the collision theory it contains no anomalous results. My prediction was correct as I stated pretty accurately what would happen in the experiment, I related back to the collision theory and what would happen if I exchanged units of solution for units of water.
Evaluation
After comparing my results with the experiments on the Internet and the ones I have seen in class I am pretty satisfied with my set of results. Even though my prediction was pretty accurate on what would happen during the experiment, it wasn’t perfect, mostly to human error on my part but one other thing I could of done better would to be more specific in my results by increasing the range. If I did the experiment again I would defiantly consider changing the above to try and get the most accurate results and graph I possibly could. The bigger the range I could get then the more accurate my graph could be, unfortunately I only used 5 results on my graph so I couldn’t get a brilliant line. But the line I got was a very good fit and had no anomalous results in it.
The experiment I carried out was a satisfactory one that could have been made better if I had used a bigger range.