For this experiment I am going to use the second method – i.e. measuring changes in mass as, for the reasons discussed above, I believe it is possible to get more accurate results.
HYPOTHESIS
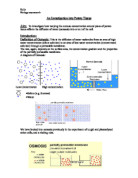
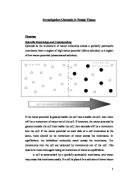
That potato chips placed in a solution of a lower water potential than that contained in their own cells will lose water by osmosis into that solution, therefore reducing in mass and becoming more flaccid. Likewise, that potato chips placed in a solution of a higher water potential than that contained in their own cells will gain water from that solution by osmosis, thus increasing in mass and becoming more turgid.
PLAN
As mentioned above, I will be measuring changes in the tissue of the cells by weighing the samples and recording the changes in their mass.
The salt content of plant cells is approximately 0.9% (a water potential of –720 KPa) so in order to test the effects of immersing potato chips in solutions of higher and lower water potentials than their own, I will need to use a range of solutions which takes this value into account. For this experiment I will be using six salt solutions, ranging in water potential from 0KPa (pure water) to –1000KPa as this should give a gradual change in results and show how even a relatively small difference in water potential from that in the cell can affect the amount of water contained in the cell over the course of the experiment. These water potentials are to be: 0KPa, -200KPa, -400KPa, -600KPa, -800KPa and –1000KPa.
In addition to using a range of strengths of solution, I will also use several potato tissue samples to reduce the risk of anomalous results affecting the outcome. For each strength of solution, I will use 5 potato chips and take the mean values for these when calculating the overall change in mass. By doing this, I hope to limit the margin for error caused by such factors as inaccuracies in weighing or cutting the chips and natural variation in the potato tissue.
The steps that I will follow in the experiment are as follows:
- Accurately measure out 40cm3 of each solution into petri-dishes.
- Using a cork borer, of the same diameter for the duration of the experiment, take potato chip samples from the potato. Try to make the samples as long as possible.
- Cut the samples so that they are all the same length.
- Weigh the samples (first briefly wetting them in the solution they are to be immersed in and drying them with 2 flicks). Record masses in a table.
- When all the samples have been weighed, place them in their solutions and leave them there for an hour.
- Remove the samples. Dry them with two flicks and weigh them. Record their final masses in a table. Also observe any changes in turgidity in the samples.
CONTROLLING THE VARIABLES
Variables that will stay the same in the experiment are:
- Volume of solution ( = 40cm3) in each petri-dish (this can be assured through careful measuring and using a lid to prevent excessive evaporation)
- Length of potato chips ( = 3cm) controlled by careful measuring and taking care that the ends of the chips are cut perpendicularly.
- Time that the chips are immersed in the solutions ( = 1hour). Kept consistent for all samples by placing the chips in the solutions at the same time and taking similar care when removing them.
- Number of potato samples used per solution ( = 5), giving an overall mean value which will be more accurate than taking single values as it reduces the margin for error and anomalous results affecting the outcome.
The only variable which will be changed is the water potential of the solutions that the potato chips are placed in. As mentioned in the plan above, this will be done by taking 6 different strengths of solutions; starting with 0KPa and reducing in 200KPa increments to -1000KPa.
The variable that will be measured is the change in mass of the potato chips. This will be done by recording both the initial and final masses of the chips. For maximum accuracy, the method for weighing the chips mentioned above in “Possible Methods” will be closely followed.
2. METHOD
Using a beaker and 10cm3 measuring cylinder, 40cm3 of each solution was measured out into petri-dishes and the petri-dishes were labelled to prevent solutions from becoming mixed up. The petri-dishes were also covered to prevent excessive evaporation while the rest of the preparation was carried out.
In between measuring each solution, the beaker and measuring cylinder were rinsed in the next strength of solution to be used so that the measured solution remained as close as possible to their true water potentials and were not concentrated or diluted by solution remaining from the previous measuring.
The potato chip samples were taken from the potato using a cork borer. This made it easier to get long chips – important to reduce the proportional importance of inaccuracies in the weighing and measuring throughout the experiment. It also ensured that the samples were of the same diameter. The potato chips were then cut to equal lengths by measuring them carefully and by cutting the ends vertically.
The initial weighing of the chips was then carried out. One at a time, the chips were briefly immersed in their assigned solution, given two flicks to remove excess liquid and then weighed. The balance was carefully monitored to ensure that any accumulations of solution from the chips on the balance were taken into account when recording the mass of the next chip. This involved occasionally taring the balance or drying it.
To ensure that all the chips were placed in their solutions for the same length of time, while the other chips were being weighed, those that had already been weighed were placed in clean, dry, labelled, petri-dishes. This also prevented the chips from being contaminated by substances on the bench, or from being placed in a solution that they had not originally been immersed in (which would have the effect of slightly altering its water potential).
Once all the initial masses had been recorded, the chips were placed in the solutions and the time was noted.
After one hour, the chips were removed from the solutions, dried by flicking them twice as before and the final masses were recorded. Any observed changes in a group of chips’ turgidity were also noted.
RISK ASSESSMENT
During this experiment it will be necessary to use several potentially dangerous pieces of equipment: a scalpel to cut the potato samples to the correct length and glass measuring cylinders and bottles containing the various solutions. In order to overcome these hazards, specific precautions need to be taken:
- All glassware should be kept in a place where it cannot be knocked over and broken, preferably at the side of the laboratory once the solutions have been measured.
- The scalpel should be used with care and again put in a safe place once it is no longer required for the experiment.
- Any spillages should be cleared up immediately.
- There should be a clearly marked first aid kit to hand in the laboratory.
3. RESULTS
RESULTS OF PRELIMINARY EXPERIMENT
Table 1 – The change in length of potato chips soaked in water and 10% salt solutions
RESULTS OF FULL EXPERIMENT
Table 2 – Initial Mass of Potato Chips
Table 3 – Final Mass of Potato Chips
In addition to the changes in mass, the samples placed in solutions of a particularly high or particularly low water potential were observed to have changed markedly in turgidity. The samples placed in the 0 KPa solution were much more turgid than they had been at the start of the experiment. Those placed in the –1000 KPa solution were much more flaccid.
Table 4 - Changes in mass
In order to be able to label a graph with error bars, the standard deviations of the change in mass for each water potential were calculated. These values were initially worked out in grams, then converted to a percentage change value based on the sample’s mean initial mass.
Table 5 – Standard Deviation of changes in mass
These standard deviation values can be converted into error bars on a graph by adding the standard deviation to the % change in mass to give the upper value and by subtracting the standard deviation from the % change in mass to give the lower value.
4a. ANALYSIS OF RESULTS – PRELIMINARY EXPERIMENT
The results of the preliminary experiment show clearly that the potato chip placed in the 10% NaCl (-8000KPa) solution lost mass over the course of its immersion as it is markedly shorter (-0.7cm) than it was prior to its immersion. Equally clearly it is seen that the chip immersed in pure water gained mass during this time as it is 0.8cm longer than it was at the start of the experiment. Thus it can be seen that by using two extremes of water potentials, compared to that in the average plant cell, osmosis causes a significant change in the chips. That which was immersed in the low water potential solution lost mass due to its loss of water from the cells into the surrounding salt solution. The chip which was immersed in the high water potential solution gained mass through the movement by osmosis of water into the cells.
4b. ANALYSIS OF RESULTS – FULL EXPERIMENT
The set of potato chips immersed in pure water (0KPa) showed a marked increase in turgidity when they were removed after an hour, suggesting that the hypothesis; that they would take up water through osmosis, was correct. The changes in mass supported this, as the chips were on average 6.79% heavier than prior to immersion.
The set of potato chips immersed in the strongest salt solution were noticeably more flaccid when they were removed after an hour. Once again, this supported the hypothesis that they would lose water into the solution by a process of osmosis. When the results for this set of potato chips were examined, it was seen that they were on average 14.00% lighter than they had been at the start of the experiment, confirming that the results were in accordance with the predictions made in the hypothesis.
The graph shows that the change in mass decreases steadily as the water potential is reduced: in the solution of 0KPa, there is a 6.79% increase in mass, this reduces to +4.90% with the –200KPa solution, reduces still further to +4.04% with the –400KPa solution and for the –600KPa solution, the change in mass has become negative and the chip is 1.03% lighter than it was at the start of the experiment. The samples continue to get even lighter with each further reduction in water potential of the test solution: chips placed in the -800KPa solution are a mean of 8.16% lighter, and those placed in the –1000KPa are on average 14.00% lighter.
Using the line of best fit drawn on graph B, and looking at where this crosses the x-axis, we can calculate that a solution with a water potential of about –410KPa would give no change in mass of the chips. The line of best fit was drawn to show an average gradient through the points plotted on the graph, though this method is subject to error, as the line was drawn by sight and the original line shows anomalies are present in the results. Therefore the value of –410KPa can only be a rough estimate.
All of the results show that the hypothesis was generally supported by the outcome of the experiment. However, it must be noted that all the results provided by this investigation are tentative and to gain more reliable results, the experiment would have to be repeated many times.
5. EVALUATION OF RESULTS
Although the general trend of the results shows that the hypothesis was supported by the outcome of the experiment, it is also clear from the results that some anomalies were present in the results. This can be demonstrated most clearly by looking at the line plotted for the results on the graph. Here, instead of being a completely straight line, as would be expected if the amount of water uptake/ loss is directly proportional to the water potential of the solution it is immersed in, there is a sharp change in angle at the –400KPa point. This indicates a marked change in trend between the first two results and the last six. As the line from –400KPa to –1000KPa is fairly straight and smooth and goes through four points, it could be argued that it is the first two results that are anomalous, rather than the –400KPa result itself. To prove this either way, it would be necessary to carry out many further experiments of this type; so that a more reliable average could be reached, as the significance of any errors would be reduced.
That there are inconsistencies in the results is also clear by looking at the standard variations of the changes in mass. From the error bars on graph A, it is clear that although the mean values show a reasonably steady decrease in the percentage change in mass, the possible ranges where the 68% of the values could be expected to fall are at times very wide. For example, the error bars for the 0KPa solution encompass the means for both -200KPa and –400KPa. As the error bars for 0KPa are so wide, it is much less hard to be sure that the mean we have obtained represents the true value. The use of error bars also show the limitations of using a line of best fit. Although the line drawn on graph B passes through most of the error bar ranges, it passes far below the lower limit of the error bar at the –400KPa point. This is particularly crucial as it is just below –400KPa that the line of best fit cuts the x-axis - giving our estimate for a water potential which would result in no change in mass in potato chips.
In addition to carrying out more repeats of the experiment and using more chips, another helpful way in which this experiment could be extended would be to use more solutions of different water potentials within the range; perhaps in increments of –100KPa instead of –200KPa, or even smaller increments. This would make it easier to plot a reliable line on the graph and give a better basis for calculations such as which strength of salt solution would give no change in mass in the samples.
However, in order to improve the experiment, it is important not only to reduce the importance of errors to the results, but to identify the source of the errors in order to eliminate them. Given that the test solutions were of the exact water potentials stated in the experiment, and that the potatoes used appeared to be of the same breed and age, thus having a fairly uniform water potential in their cells, the largest source of error must be in the method used to carry out the experiment.
As discussed in the “Possible methods” section, the weighing of the chips presented potential inaccuracy due to the added mass of the solution on the chips after their immersion in solution. Although the discrepancies caused by this were worked around by dipping the chips in the solutions and flicking them dry before the experiment as well as after it, this flicking dry of the chips itself introduces another source of error. This is that it is difficult to ensure that the same amount of liquid is shaken off each time, and where only small differences in mass are being dealt with, the proportional importance of the mass of a drop of water is significant. To improve the accuracy of this, more care could be taken to ensure that all the chips are shaken with the same degree of force each time, or alternative methods of drying could be used. One possibility would be to place the chip on a dry piece of paper towel after immersion and roll it back and forth twice.
Another potential source of error lay in the fact that some water from the chips remained on the balance after they had been weighed. The method of taring the balance was used several times to reduce the significance of this. However, as this was not carried out between each weighing, there was a potential error in the reading of the balance of up to 0.0049g. Once again, as very small masses are being dealt with here, a small difference such as this is potentially very significant. To reduce the chance of such factors influencing the results, the balance should be dried scrupulously between each weighing.
Once the method of the experiment has been modified to adopt these changes, the investigation could then be carried out with many repeats and using more water potentials as discussed above. However, whereas in the experiment carried out here, it was relatively easy to compare the potatoes used for the samples and see that they were of the same breed, approximate age and state of turgidity, when conducting the extended experiment, it would be very important to ensure that these factors are closely monitored to avoid bringing another potential source of error into the results.