I found from my results that as the temperature increases so does the reaction rate, up to a point. Once the temperature reaches this point, approx. 50*, the reaction rate falls off steeply until around 70* when the reaction stops completely.
These results fit in with my knowledge of enzymes as they show that the enzymes involved in this reaction work faster as they approach their optimum temperature. Once they reach this temperature they are working at their most efficient and the reaction rate is at its highest. However, if the enzymes are heated further they begin to be denatured, once an enzyme has been denatured it no longer functions i.e. it no longer causes a reaction. Once all the enzymes have been denatured, at around 80* the reaction can no longer take place, and it stops. A graph showing an enzyme reaction should look something like this:
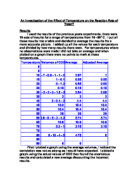
My first graph showed the average values of CO2 against temperature. My line of best fit showed a sharp curved correlation, peaking at around 50* and falling to zero at around 90*. However it also showed several points which were quite a way from the line of best fit and 90* seemed to high an end point for a reaction involving enzymes.
My second graph showed the actual volumes of CO2 against temperature. I found that the line of best fit still followed a similar course but the end point of my curve was at 80 rather than 90*. This graph showed anomalous results clearly as they stood out from the clusters of values around my line of best fit. From his graph I was able to pick out 7 anomalous results.
My third graph showed the adjusted average CO2 volumes, calculated without the anomalous results. These results formed a much stronger correlation than in my previous graphs and my line of best fit was much more like the type of curve I would expect form a reaction involving enzymes, peaking at around 50* and finishing at around 80*. This was also the most accurate of the three graphs as it did not include any anomalous results.
Evaluation
I found that the results to this experiment were actually quite difficult to interpret as there were no standard changes in variables. If I was doing the experiment from start to finish I would take measurements at 10* temperature intervals from 10* to 90*. I would take two observations for each temperature so as to pick up on anomalies. i f I did come across an anomalous result I would re[eat that observation again until I could find an accurate pair of results. By taking 10* temperature readings I would be able to cover a wide range of temperatures without huge amounts of readings.
I thought that my method for analysing the data was effective as it allowed me to create an accurate picture using all the data available to me in the most efficient way possible. There are many possible reasons for the anomalous results that I found, for example the measurements of temperature or mass may have been incorrect for that observation. There may have been an error when the result was recorded or the equipment may have been set up inaccurately. I f I was doing this experiment I would explore all the variables which may affect this experiment, temperature, mass, measuring errors and recording errors and, by doing preliminary work on the process, find out how best to keep the key factors constant. Overall my analysis of this experiment was accurate, effective and informative however it would be improved by improving the reliability of the results themselves. I also found that my analysis matched my conclusion, the enzymes had behaved as I expected them to , showing that my experiment was successful in proving it’s aim.