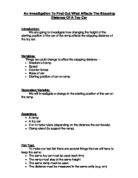
Diagram:
Safety: In an experiment like this there aren’t many safety precautions to take as nothing dangerous is being used but the ramps could easily be tripped over and cause injuries – to ensure this doesn’t happen people must act sensibly.
Method:
- Set up the apparatus as it is show in the diagram
- Make sure the ramp is marked at every 10cm from the bottom of the ramp
- Start the toy car from behind the 10cm mark on the ramp, let it roll down the ramp and measure the distance it travels with the rulers. If it doesn’t travel in a straight line (or fairly straight direction) do this again.
- Repeat this twice so you have three different results
- Do the same thing every 10cm up the ramp until 90cm three times each
- Find an average result for each height by using the 3 different results for each height.
Prediction:
I predict that the further upwards the car is started on the ramp, the further it will travel which means the stopping distance will be longer. This is because when the car is high up on the ramp it has a longer distance to accelerate. We know this makes the stopping distance longer by using this formula –
V=AxT
Velocity = Acceleration x Time
This is the formula used to find the velocity. As the time (t) increases so does the velocity and more velocity makes the stopping distance longer.
The higher up the car is started, the more potential energy there is. There will be more potential energy to be transferred into kinetic as it reaches the bottom of the ramp. When the car eventually stops – all the kinetic energy has turned into heat energy because of the friction between the car wheels and the ground.
As the ground the car will travel on as it leaves the ramp will stay the same, the car will take longer to stop. More friction would be needed as the car travelled faster to make the stopping distance the same.
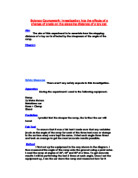
Results:
Conclusion:
In conclusion, we found out that the higher the starting point of the car on the ramp was, the longer the stopping distance was. This goes well with my prediction as it proves that my prediction was right. As the car was started higher up on the ramp, there was more time for acceleration, which allowed the car to travel faster. This was what I predicted would happen.
Evaluation:
Overall, our experiment went very well. The only problem we faced in the experiment was our toy car – it took quite a lot of attempts to get our car to go in a straight direction in order to get a sensible result. This is the only fault we have with our results. There are a couple that don’t really fit with the other attempts – for example the result from the first attempt at 90cm is quite different from the other two. But I can see on the graph that the line of best fit doesn’t show odd results so our averages must be fairly accurate. To have made them even more accurate we could have done a fourth attempt or even measured the result to the nearest millimetre but we didn’t think this was necessary for what we wanted to do.
Except for the obvious way the distance travelled becomes higher the higher the stopping distance was, there aren’t really any other patterns in our results. For the first few results (10, 20, 30, 40) I noticed a small pattern which doesn’t really continue further on. When you look at one result for a height, then a different one from that height doubled (eg. Look at the average from 10cm then from 20cm), the average is almost doubled. This only works for a couple of the results but perhaps if we had gotten more accurate results this would have been clearer and shown another pattern.