Output Variable:
I will investigate what how changing the length of putty affects the change in resistance. I will do this by increasing the length of the putty (starting at 1cm increasing the length by 2cm each time). I will work out the value of resistance using the formula ‘R=V/I’ (resistance = current/voltage). I am observing the length of the putty as
Variables to keep constant:
- Shape of the putty
- Area and thickness of the ends of the putty
- Temperature of the putty and surroundings
Prediction:
I predict that the longer the wire, the more resistance there will be. This is because the electrons in the putty will have a larger distance to travel through the wire, which would therefore increase the resistance, and lower the current flow. As the free electrons are moving through the putty they collide with the atoms in the putty transferring electrical energy to them, and this causes the resistance to increase.
The putty is made out of carbon, which is known as a semi-conductor and does not react. It would take longer for the currant to pass through the putty. When electrons have a shorter distance to flow through, there are less collisions between the electrons as seen in smaller lengths of putty. This leads to a decrease in resistance and will make it easier for the electrons to pass through.
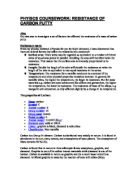
Graph to show my prediction:
Resistance
Length
I think that my results will be like the above graph because resistance is directly proportional to length.
Apparatus:
- Batteries
- Voltmeter
- Ammeter
- Putty
- Gloves
- Knife
- Variable Resistor
- Callipers
- White tile
- Switch
- Wires
- Pennies
- Ruler
Diagram of Circuit:
Health and Safety:
- Ensure your hands are dry before touching anything electric.
- Make sure that the circuit is properly connected before the power is turned on.
- Do not turn the power too high as the wire or the putty may melt
Method:
Before starting the experiment ensure that all hair is tied back, and that your clothes are safe from being damaged from the putty.
- Take some putty and using your hands roll it in to a cylinder shape and using the calliper measure the cross section of the putty all the way along to ensure the width of the putty is 1.5cm.
- On a white tile and using a knife, cut the putty into different lengths using a ruler.(starting at 20cm, and reducing by 4cm each time – 20 cm, 16cm, 12cm, 8cm, 4cm as this range will give me a wider area of results).
- Set up the circuit as shown in the diagram above. On the ends of the bits of putty pit 1 pence coins so the crocodile clips can be clipped on to them.
- Adjust the currant to 6V and record the readings from the voltmeter on to a table of results.
- Keep the currant the same and connect the next length of putty to the circuit, and carry on doing this until all 5 lengths have been tested.
- Repeat the experiment 3 times, working out the resistance for each result using the formula ‘R=V/I’.
Before carrying out the experiment, preliminary work was done in order to find out which width would be best to use in order to achieve good, reliable results. I tested 3 different widths at 1cm, 1.5cm and 2cm.
Fair test:
To ensure that my experiment is a fair test I will keep the following factors the same:
-
The shape of the putty – I will achieve a constant shape by using callipers to make sure that the width of the putty is the same all the way across it. This is as the wider the width, the less the resistance there will be. I will put a 1p coin at each of the ends of the putty and clipping crocodile clips on to the pennies rather than onto the putty to ensure that it will not get squashed, or change the shape or area of the putty.
-
Temperature – I will keep the temperature the same by carrying out the experiment in the same room and by not opening any windows once the experiment has begun. The higher the temperature, the more the resistance.
-
Wires – I will use the same wires for each of my experiments to ensure they are all the same size. Also, the material of the wire should be the same each time as this may effect the outcome of the experiment.
-
Current – I will keep the current flowing through the wires the same to ensure that it will not affect the outcome of my results.
Results:
Analysis:
From the results I drew a graph to show the relationship between resistance and the putty length. I drew a graph of the average results, and the line of best fit shows my results. I have found out that as the putty length increases, so does the resistance.
In order to make my results as accurate as possible I did the experiment 3 times and drew a graph of results based on the average. There’s a strong pattern shown in my results, which is that as the length of the putty increases, so does the resistance. This is because there’s a longer distance for the electrons to travel along; therefore there are more collisions between them. The width doesn’t increase, so there’s further to go and the same amount of space in which to go down the putty so the electrons collide more.
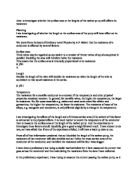
There’s a definite relationship between resistance and putty length; there’s a positive correlation. In my prediction I stated that I thought that resistance would increase with putty length and that my graph of results would look something like this:
Resistance
Length
My prediction was correct, as this is what my graph of results looks like. There’s a straight line of best fit, which shows that resistance is indeed directionally proportional to the length of the putty.
Evaluation:
Overall, I think my experiment went well and I got the results that I had expected. All the points fit my prediction and the range of results helped us to find out that resistance increased with length and that they are directionally proportional.
The method we used was quite good as it helped us achieve good, reliable results. However, when we had to cut the putty to the different length we struggled in ensuring that it was the correct length. We had to measure very accurately as to not make the results anomalous. The current was easy to fix as we used a variable resistor to make certain the current stayed at 0.11A. We controlled the thickness of the putty by using callipers and measuring the width to 1.5cm. The temperature was very hard to control as the putty could have changed temperature through the experiment and the temperature of our surroundings may have changed. We managed to avoid this problem however by leaving the putty for 2 minute intervals between measuring to let the putty cool down.
Some of my results did not fit the line of best fit. This could have been due to human error. For example, we may have to cut the putty to the correct length or we may have not got the correct width. It was hard to keep a constant cylindrical shape throughout the length of the putty and sometimes it was hard to read the voltmeter as the reading on it was quickly changing. This may have led to errors in the results and may explain why not all the points fit the line of best fit. However, the trend remains firm despite the anomalies, which means that the experiment was good enough to come to a reliable and accurate conclusion as to how length affects the resistance of conducting putty. There were two extreme anomalies which we retested and got normal answers for.
To test the reliability of my results I could carry out the whole experiment again to see if I get similar results and if I had more time I could have done more repeats. This would improve the reliability of my results and would confirm that the results I got in the first experiment were accurate. I could also try using a wider range of lengths and investigate more lengths, eg increasing every cm.
If I were to do the experiment again I would use a wider range of lengths and increase each length by 1cm each time. I would use the following method:
- Take some putty and using your hands roll it in to sausage like cylindrical shape. Use callipers to ensure that the putty is 1.5cm wide the whole way through.
- On a white tile and using a knife, cut the putty into different lengths using a ruler.(starting at 30cm and decreasing by 1cm each time until the putty is 1cm long).
- Set up the circuit as shown in the diagram above. Put 2p coins on the end of the putty so that the crocodile clips can be clipped on to them.
- Adjust the current to 6V and record the readings from the voltmeter on to a table of results.
- Keep the currant the same and connect the next length of putty to the circuit, and carry on doing this until all 5 lengths have been tested.
- Repeat the experiment 3 times, working out the resistance for each result using the formula ‘R=V/I’.
Other ways I could extend the experiment could be to use different materials such as putty, for example wire to see if I get a similar pattern of results and I could also change the thickness of the material.