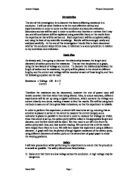
- Semiconductor Diodes
The graph below shows that current passes when the voltage is applied in one direction but is almost zero when it acts in the opposite direction. A diode has a resistance that is only large one way; the other way it is very small. It conducts in one direction only and is a non-ohmic conductor. “GCSE Physics” by Tom Duncan, states that “this makes it useful as a rectifier for changing alternating current (a.c.) to direct current (d.c.).
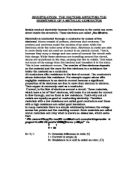
- Filament Lamp
A filament lamp, for example a torch bulb, the V-I bends over as V and I increase. This means that the resistance increases as I increases and makes the filament hotter. Therefore the temperature does not remain constant:
- Variation of resistance with temperature:
As a rule, if you increase the temperature you increase the resistance of the metals, and this applies to the filament lamp, but it decreases the resistance of a semi-conductor. The resistance of most thermistors decreases as the temperature rises, and the I-V bends or curves upwards:
This scientific knowledge helped me to understand what would happen, allowing me to make my prediction below, and also write my detailed strategy. This also helped me to understand what the control variables would be, and also what I would need to change in the experiment.
Prediction
Using the scientific theory obtained I believe I can make some sort of prediction based on the theories of Ohms Law. Also I can confirm the scientific theory of measuring and confirming the factors of resistance within a circuit.
I believe that, since carbon putty contains a conducting material and will allow a current to flow through it, as long as the temperature remains constant the carbon putty will obey Ohms Law. I can confirm this because the putty is not a diode, filament lamp or a thermistor, and therefore the shape of the graph is not predictable unless it applies to one of these categories. However, if the carbon putty obeys Ohms law the prediction graph will show the shape of the final graph produced from the results. I can confirm this because of the following scientific theory:
Ohms Law is defined as:
“The amount of current flowing in a circuit made up of pure resistances is directly proportional to the electromotive forces impressed on the circuit and inversely proportional to the total resistance of the circuit.”
Or, also:
“The current flowing through a metal wire is directly proportional to the potential difference across it, providing that the temperature remains constant.”
I believe that the carbon putty will act in the same way as a metallic conductor, so a graph of current against voltage would so a straight line, therefore a graph of resistance against length would also be directly proportional. A graph of resistance against area would be inversely proportional, making resistance against 1/area directly proportional.
I can simply state that if it does obey Ohms Law the above result will occur. I cannot predict the actual measurements on the graph itself, only the shape it will produce, so any numbers on the graph are to demonstrate direct proportionality only, and not the results I believe will be present. However, I can base the graph on the preliminary results, and the basic numbers used in that context.
I can predict a result to discover how its length affects the resistance of carbon putty. I predict that as I shorten the length of the putty, the resistance will decrease. I can confirm this prediction because the scientific theory written states the following. Also, I believe that if the cross-sectional area of the putty increases, the resistance will decrease making them inversely proportional. I can prove these predictions by the following:-
Electrons move more easily through some conductors than others when a potential difference (voltage) is applied. In a given energy source, the size of the current depends on the resistance. All conductors resist the flow of electrical charge to some extent, however some are more capable of doing so than others.
“All metals are good conductors. This is because they have a large number of free electrons that can move easily from atom to atom, so therefore current flows. A good conductor has a low resistance and a poor conductor has a high resistance. A thin wire in a lamp will resist the movement of electrons that is within it. Therefore we can conclude that the wire has a resistance to the current. The greater the resistance, the more voltage that is required to move a current through the wire.”
There are four factors that affect resistance:
1. As the length increases, the resistance increases
- As cross-sectional area increases, the resistance decreases
- Copper is a good conductor and is used for connecting wires. Nichrome has more resistance and is used in the heating elements of electric fires
- As the temperature increases, the resistance of the wire increases
A long, thin wire has more resistance than a short thick one of the same material.
Therefore one of the factors of resistance is that as the length increases, so does the resistance. Therefore the resistance will decrease as I shorten the length of the putty, and as long as the cross-sectional area remains constant throughout the putty and the temperature remains constant, there will be a decrease that will be directly proportional to the length. This will result in a straight line on a graph that passes through the origin. I can confirm this because if no other factors affect the decrease in resistance, the decrease must be constant. I can draw a prediction graph to show this decrease, however I cannot predict what the resistance will be, as I do not know how the current and voltage will change in order to result in a decrease in the resistance. Therefore only the shape of the graph can be predicted, and not the actual resistance in Ohms.
Below is a sketch to show what my graph should look like.
As you can see, the smaller diameters show a higher resistance, so the gradients will be steeper.
Therefore, it is predicated that the resistance is proportional to the length, but inversely proportional to the diameter.
Preliminary Testing
In order to conclude what method would be the most suitable to use in the investigation, I need to decide on a particular method that I deem to be the most suitable and the most efficient in order to carry out the experimentation to the best of my ability. I also need to consider appropriate equipment and observe measurements that can be concluded in “Measurements and Observations.”
A simple circuit needed to be created, and there were not very many options within that circuit, as this was an essential way of collecting appropriate data. I decided to use a multimeter and a circuit board, that allows precise lengths to be taken, and therefore accurate results. The multimeter creates its own circuit, and can read the resistance through the wire without needing to work calculations between the relationship of voltage and current.
I collected the multimeter, the circuit board, as well as several lengths of wire ( with varying diameters), and constructed a simple circuit by placing the wire at different lengths on the circuit board. There were sockets at either and to what the wire was attached, allowing the wire to be attached to the terminals of the multimeter easily. From the experiment, I collected the results in a table and then plotted a graph from the results using three different diameters of wire.
Preliminary Results
0.2mm diameter
0.14mm diameter
0.28 mm diameter
As mentioned before, these results were plotted on the same graph.
From the preliminary testing, I concluded that a more appropriate selection of apparatus and method could have been used. I decided to use carbon putty as the equipment, since the diameter and lengths can we used as desired. With the wire, only a certain number or lengths and diameters are available. Also, I may introduce an ammeter and voltmeter into the circuit. This will mean that that exact voltage and current can be found, and the resistance will be derived from that. Different experiments will be set up, some with the ammeter/voltmeter method, and the others finding resistance using the multimeter. As mentioned, when the voltmeter/ammeter method is being used, a power-pack will be needed, keeping the power levels constant.
My results showed that when the length increased, the resistance increased to show that they are directly proportional. I hope to see a very similar trend of results when I perform my main experiment, hopefully to a higher degree of accuracy (since in this circuit, other factors were causing resistance, not just the wire).
Secondary Sources of information
This is a table that I found in a similar project, that shows the resistance when a current was applied to Teledeltos Paper. This experiment was in fact very similar to this one, but using a different conductor. Since it obeys ohm’s law, I thought it may be appropriate to show the results, as seen below:
This table above shows that when the length decreases, the resistance decreases. I hope to see this trend in my main set of results.
Measurements and Observations
After completing the preliminary tests, I was able to confirm some sort of method and a rough idea of what I will be using in each experiment in order to complete the investigation. After conducting trials in the preliminary tests, I was able to confirm the measurements suitable for each experiment, and also the method that will be used. One of the first factors that need to be considered is the lengths of the carbon putty. I will star at 18cm, and go down 2cm every time until 2cm is reached( therefore from 18cm – 2cm).
I also needed to decide the different diameters of carbon putty that will be used. I decided to base this on how easily the results would spread over one graph, showing a good range of observations (i.e. a thick diameter as well as a thin diameter). I chose the diameters as 2.3 cm, 2cm, 1.5cm, 1.2cm, and 1cm. Also, for the ammeter/voltmeter experiment, the voltage from the power pack will remain constant throughout.
1.5cm, 2.3cm, and 1 cm were for the ammeter/voltmeter experiment.
2 cm and 1.2 cm were for the multimeter.
As mentioned, two different types of circuits are going to be set up. A multimeter one, and a voltmeter/ammeter one. A brief explanation including a range of observations will be described here. A more detailed method will be shown later on:
Multimeter experiment
In this experiment, the multimeter is connected directly to the carbon putty. The ohms setting should be used. The lengths of the carbon putty will be altered, and the results recorded in a table as shown below.
Also, a circuit will be set up as shown below:
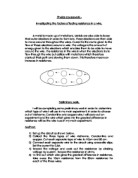
Voltmeter/Ammeter experiment
In this experiment, a power pack will be used, and the setting will need to be kept consistent at 5volts. A voltmeter will be connected in parallel across the carbon putty, and an ammeter will be connection in series in the circuit. Crocodile clips will be connected to two 2p coins, that will be placed at either end of the carbon putty to make a circuit. The voltmeter and ammeter readings will be taken, and then the connections at the d.c. terminal will be swapped around, giving two sets of readings for each measurement. An average will be taken of these readings, and the average derived from them. An example of the results table is shown below:
A circuit of this is shown below:
Temperature
The temperature will remain as consistent as possible, that being room temperature (around 20 degrees Celsius). This could change, but this is often beyond our control.
I believe that my readings will be very precise and exactly reproducible. In addition, I may decide to plot my results as I go, and will repeat any reading that looks out of place.
Apparatus
After much consideration and preliminary trials in order to discover a suitable method, I have concluded a range of apparatus that I believe will provide me with the optimum level of safety, accuracy and simplicity.
Carbon Putty: Obviously, this apparatus is essential to the completion of the investigation. However it is entirely suitable for the process, as it is can be shaped exactly how I want it, therefore allowing a large number of diameters and results to be used. We already know it obeys ohms law. These reasons show why it is superior to a wire in these experiments.
A Power Unit: I concluded that a power unit would be the safest and most simplistic choice to use in this investigation. If two battery packs were used it would result in a lot more wiring, and much more space taken up as a result, which would mean a crowded working area. Up to voltage thirteen needed to be used, and the power unit could supply this range effectively, and this can be easily altered and the power can be raised or lowered without any danger to the user. Only two wires are attached to the equipment, and this can be installed easily and safely. The power unit increases the simplicity of the experiment to a great degree rather than using another piece of apparatus such as the battery packs, as they are difficult to arrange and cannot supply a continuous power because the batteries could run out during the experiment. Therefore this apparatus will be able to provide an effective degree of accuracy.
A Voltmeter: The voltmeter is a very simple device, which is easily attached to the circuit. It can measure any relatively high voltage, and as the reading is quite high the apparatus was entirely suitable. It is attached in parallel to the circuit by two wires, and I concluded that it would be the most suitable apparatus because it is easily accessible, and most of all extremely simple to operate, thereby decreasing any chances of error in the investigation, and increasing accuracy.
Ammeter: Same reasons as the voltmeter, but placed in series in the circuit
Digital Multimeter: This will also be used for different circuits. Useful, because it generates its own power supply and can also convert the amps and volt directly into resistance.
5 wires for ammeter/voltmeter experiment: To connect up the circuit
2 wires for the multimeter experiment: To connect the carbon putty to the multimeter
Two Crocodile Clips: The crocodile clips are attached on the end of two of the wires to make contact with the 2p coins in the ammeter/ voltmeter experiment.
2p coins: Make contact with the carbon putty at either end.
Scalpel: To cut the putty to the desired length.
Transparent mm Ruler: I concluded that an accurate ruler should be used, rather than a ruler that can only measure cm. This increases my chances of accuracy in the experiment, as the ruler can measure the carbon putty to the nearest mm, and as it is transparent the straightness of the measurement can be observed, to ensure that it is not measured at a slant.
Detailed Strategy
After looking at all the basic requirements for the experiment, we can draw up a detailed method with which we can conclude the preparation of the experiment. The apparatus, measurements, variables and plan will be taken into account, as well as the highest standard of safety possible. All wires must be checked for breaks or any bare wire that may show, otherwise this could result in electrocution of the user. The method will be performed taking into account all of the laboratory safety precautions in order to perform a safe investigation.
My scientific knowledge, as mentioned above, allowed me to conclude the best method to use. I have already concluded the control variables and dependant variables, so need a suitable method to fit them into my experiment.
Scientific knowledge, such the ones shown below, helped me to decide what I should and should not change:
- Resistance increases as the conductor’s length increases.
- Resistance increases as the conductor’s cross-sectional area decreases.
- Resistance varies depending on the type of material being used.
The diagram above showed me how a graph should look with an ohmic conductor, so I will be able to see anomalous results. These will be mentioned later in my project.
As it is known what affects resistance, I need to make sure that these factors need to be kept constant whilst performing the experiments, i.e. the temperature and the diameter of the carbon putty to make sure that my results produced are very reliable. It is important to stress that THE HIGHER THE VOLTAGE FROM THE POWER PACK, THE HIGHER THE TEMPERATURE WILL BECOME. Since I know that the voltage and current flowing through the putty will increase temperature, the voltage needs to remain constant at a fairly low voltage (i.e. 5volts) to ensure that the temperature is the same, and does not increase inconsistently, to produce inaccurate results.
I need to perform two different types of experiment, the ammeter/ voltmeter experiment and also the multimeter experiment. I have therefor divided my method into two parts to shows these different experiments.
- The Ammeter/Voltmeter experiment:
From my scientific knowledge, I have discovered what I hope to be the best way of producing this experiment. I have learned how to set up circuits, and that the voltmeter needs to be in parallel, and the ammeter in series in the circuits. Also, as mentioned above, I have learnt the different factors affecting resistance, allowing me to produce the best possible procedure:
- Set up circuit as shown in the diagram in the measurement and observations section of the project. This includes setting the power pack to 5 volts, having the ammeter in series in the circuit and having the voltmeter in series across the carbon putty.
- Roll the carbon putty to the appropriate length and diameter. Use gloves to ensure safety. Use a scalpel to cut the two ends of the carbon putty to make them equal (N.B. I have found that it would be wiser to roll the putty longer than you need it, so that it can be cut to the appropriate length. Focus on getting a good diameter. Worry about the length afterwards.)
- Once the putty is at the correct length and diameter, connect the two 2p coins to either end of the putty (making sure they are attached to the crocodile clips.
- Switch on the circuit, and record the ammeter and voltmeter readings.
- Reverse the connectors at the D.C. terminal, take the ammeter, voltmeter readings.
- Repeat until all length at 2cm intervals from 18cm to 2cm have been performed.
- Work out an average from the two ammeter/ voltmeter readings from each one (when you reversed the d.c. terminals), and then work out the resistance from the diameters.
- Repeat the experiment with 2 other diameters of carbon putty, making a total of 3 ammeter/voltmeter results. Plot a graph of these 3 sets of results with resistance against length. Draw a line of best fit through each set of results, and label each line with the according diameter.
- The multimeter experiment
From my scientific knowledge, I have discovered what I hope to be the best way of producing this experiment. I have learned how to set up circuits, and that only the multimeter and the carbon putty is needed to work out the resistance. I have learnt the different factors affecting resistance, allowing me to produce the best possible procedure:
- Set up the circuit as shown in the measurements and observations section
- Roll the carbon putty to the appropriate length and diameter. Use gloves to ensure safety. Use a scalpel to cut the two ends of the carbon putty to make them equal (N.B. I have found that it would be wiser to roll the putty longer than you need it, so that it can be cut to the appropriate length. Focus on getting a good diameter. Worry about the length afterwards.)
- Attach the leads to the ________ and the ________ terminals of the multimeter. Set the multimeter to ___________
- Attach the other ends of these two leads to either end of the putty.
- Once the circuit is set up, take the first reading from the multimeter. This should be resistance in ohms.
- Repeat until all length at 2cm intervals from 18cm to 2cm have been performed.
- Repeat the experiment with 1 other diameter of carbon putty, making a total of 2 multimeter results. Plot a graph of these 2sets of results with resistance against length. Draw a line of best fit through each set of results, and label each line with the according diameter.
Overall, have structured my method by aid of my scientific knowledge to produce precise and reliable measurements. As long as the temperature remains constant, and the shape of the carbon putty is constant throughout, a believe that my results will be accurate.
I considered using many different conductors to allow me to see a range of results. But , from my scientific knowledge, I found that not all conductors at in the same way. The type of conductor I wanted was an ohmic conductor, and I would not be sure if the conductor if I was using followed this trend. With carbon putty, I already knew that it would.
I also considered varying the temperature to see how the resistance changed. This would have been difficult to perform, as making the whole of the carbon putty would have taken time and patience, and also very difficult. I concluded that the results would be inaccurate, so abandoned this idea.
Results
Ammeter/Voltmeter experiment
Diameter 1cm
Diameter 1.5 cm
Diameter 2.3 cm
Multimeter Experiment
Diameter 1.2 cm
Diameter 2cm
For the multimeter experiment, the readings were all satisfactory, so I decided that only going up to 14cm length would be adequate. For the voltmeter/ammeter experiment, there were more anomalous results so I needed to make the lengths higher to find a good line of best fit in my graphs.
For the 1.5 cm diameter in the voltmeter/ammeter experiment, many of the results were repeated, since the resistance did not show a proportional trend to the length. Once repeated, I found that the results were suitable. I believe that there may have been some sort of fault with the ammeter, as it was giving false readings. I replaced the ammeter, and then found that the results produced were satisfactory.
As you can see in my voltmeter/ammeter tables, I found averages from the two results. To do this, all I had to do was to add the two results together, and then divide them by two. I then found the resistance, as mentioned before, by using:
R=V
I
I used the volts and amps average for each length to find the resistance.
Using the equipment safely
The equipment I used (as mentioned in the apparatus section), was used safely and allowed me to perform the experiment with a great deal of accuracy, but also safely. Although I found safety goggles unnecessary, I still wore plastic gloves to keep the hands clean from carbon, and was also likely to avoid the contact with eyes. Precautions were taken whilst using the electrical equipment, to make sure that It was in good shape (i.e. no loose wires) and a low power setting was used on the power pack. The scalpel was used with extreme care, making sure that my fingers were well away whilst cutting through the carbon putty.
Using this equipment, we measured the length of the carbon putty (using the ruler), and then once the circuit was set up, used an ammeter, voltmeter or multimeter to find the voltage, amps or resistance in the putty. The experiment as said before was repeated several times with different diameters. A set power level from the power pack was used each time.
Making the measurements
Using a roll of carbon putty, we eventually found the resistance using different methods. In the multimeter experiment, everything went as planned. The circuit was set up, and using different lengths of carbon putty, good results were shown on the multimeter.
In the ammeter/voltmeter experiment, slight difficulties were encountered (i.e. bad readings) but these were soon found, and the experiment was performed using a power pack, a voltmeter in parallel to the putty and an ammeter in series to the putty. The lengths of the putty were changed, and we obtained our results.
In both experiments, the experiments were repeated to obtain different diameters.
In the voltmeter/ammeter experiment, the power pack was set at 5 volts, and the lengths ranged from 18cm to 2cm, changing 2cm each time. Varying diameters were taken, of 1cm, 1.5cm and 2.3cm.
In the multimeter experiment, the multimeter produced its own power source, and the lengths ranged from 14cm to 2cm, changing 2 cm each time. I found that the results were behaving very consistently, so only going up to 14cm was adequate. Diameters of 2cm and 1.2cm were taken.
Precision
As expected in my plan, my equipment was used to a high degree of accuracy, and I therefore managed to obtain good results. The carbon putty was rolled so that the cross sectional area was the same throughout, and it was cut at both ends making it completely symmetrical.
The multimeter was set on the level as stated, not too high and not too low, allowing a good range of results for our experiment to be taken, As the multimeter takes resistance directly, it allowed a good trend of results to be taken.
We took precautions such as making sure that all of the contacts were in place, and making sure that the 2p coins that were used provided a complete connection with the carbon putty. Also we eliminated the more ‘odd’ results by eliminating them as we went, to perform the experiment to an even higher degree of accuracy.
We could easily tell which results were false, by working out the resistance as we went, allowing a break in the trend of results to be seen. These results could then be repeated, and the correct ones taken. If these had not been repeated, the overall results would have been less accurate, also effecting the graphs.
Analysis
Extra Calculations
These are some additional calculations that I made from my results, looking at them from different perspectives to support my conclusion.
1) Results of the resistance against area- I took one common result (12cm) and then for each experiment worked out resistance, diameter, area and 1/area. For the 1/area graph that I will draw, it should show a straight line since area is inversely proportional to the resistance. That would make 1/area directly proportional.
I used the formula ∏r2 to work out the area. r = radius which is half the diameter.
2) Resistivity of the putty – Using the equation : resistance x area
length, I managed to work out the resistivity of the putty for each diameter. As before, I used a common value of 12cm for the length of each diameter. I have the results below:
2.0cm – 4.66 Ωcm
1.2cm – 4.07 Ωcm
2.3cm – 2.96 Ωcm
1.5cm – 3.62 Ωcm
1.0cm – 3.50 Ωcm
I then added all of these together, and divided by 5, to find a total average which was 3.76.
Conclusion
After constructing a table of results in order to display the findings of the experiment, I could obtain an average set of results with which I created a graph. On this I drew a line of best fit that would display my findings clearly, and using the table and the graph I can conclude my results, based on my prediction and using scientific theory:
Ohms Law
Ohm’s Law is a set of formulas used in electronics to calculate an unknown amount of current, voltage or resistance.
For many conductors a simple rule can be produced that connects, current, voltage and resistance effectively. The relationship within this law is that if the voltage applied to the circuit is doubles, so does the applied current, and if the potential difference is halved, so is the voltage. This only applies to conductors is the temperature remains constant, and as the temperature of carbon putty did not significantly increase, Ohms Law applies to this conductor.
Ohms Law is defined as:
“The amount of current flowing in a circuit made up of pure resistances is directly proportional to the electromotive forces impressed on the circuit and inversely proportional to the total resistance of the circuit.”
Or, also:
“The current flowing through a metal wire is directly proportional to the potential difference across it, providing that the temperature remains constant.”
Therefore, this means:
-
A steady increase in voltage, in a circuit with constant resistance, produces a constant linear rise in current, as shown in this graph:
(This conductor obeys Ohms law, because there is a straight line through the origin.)
- A steady increase in resistance, in a circuit with constant voltage, produces a progressively (not straight line if graphed) weaker current.
The formula is written as I – V/R, or R = V/I. This formula can be used to make calculations with the values of V for a given conductor. The resistance may be affected if the temperature of the conductor increases.
Many laws in physics are stated to be unbreakable; however this is not how Ohms Law is defined. It does not state what must occur; it simply describes the behaviour of materials. This of course applied on to metals, ionic solutions and in some cases carbon. Many conductors do not obey Ohms Law, as their temperature increases.
Current-Voltage Graphs: Ohm’s Law
The results from completing a circuit where voltage and current can be measured allows the current to be plotted against the voltage for different conductors.
- Metallic Conductors
Metals and some alloys produce Current-Voltage graphs that compose of a straight line through the origin, and this only occurs if the temperature remains constant. A conductor that will give a graph of this shape is known as “ohmic” or “linear” conductors, since I is directly proportional to V. The resistance of an ohmic conductor does not change when the voltage does:
How this had lead me to a strong conclusion and supports my original prediction
Therefore carbon putty is a linear conductor, and it obeyed Ohms Law, as it is not a diode, filament lamp or thermistor and its temperature remained constant throughout the experiment.
These results support my original prediction and have allowed me to come to a strong conclusion, as my results have corresponded exactly with my prediction. My actual graph is exactly the same shape as my prediction graph, showing a line of best fit that is straight, and that passes through the origin. As you can see for my graphs, I was also correct in saying that the smaller diameters will show steeper gradients.
Therefore these results support the original prediction, and have allowed me to come to a strong conclusion that I would display to a third party as I am sure of my results, as it directly corresponds to my prediction, because of the reasons explained in the above conclusion.
The conclusion explaining how the resistance of carbon putty is affected by the length and diameter.
After observing the graph showing the results to how the resistance of carbon putty is affected by the length, I can confirm that there is a straight line of best fit that passes directly through the origin. As the length of the carbon putty paper on the graph increases, the resistance of the carbon putty increases, or as the length on the graph decreases, the resistance of the carbon putty paper decreases. The gradient is constant, and does not vary at any point on the graph; therefore a straight line is produced. The shape of the graph remains straight, and is continuous, and passes through or next to all of the results. The graph displays the same number points plotted on either side of the line of best fit within close proximity to the line that has been drawn, and no result differs greatly from any of the others. Also, we can see that as the cross sectional area or diameter of the carbon putty increases, the resistance decreases, and vice versa. We can conclude that they are inversely proportional. Therefore a graph of resistance against 1/area would be directly proportional. As shown.
Therefore, as the graph is a straight line of best fit through the origin, as the length of the carbon putty paper increases, so does the resistance, and this increase shows variables that are directly proportional to each other. This indicates that other factors must have remained constant for this to occur, as the increase is steady and does not vary from the direct proportionality. I can confirm that my conclusion is correct from the following detailed scientific knowledge:
Electrons are capable of moving much more easily through some conductors rather than others, when potential difference is applied. A given energy source such as a battery or generator will contain a current that’s size is decided by the resistance in the circuit. All conductors resist the flow of electrical charge to some extent, however some are much better at this than others.
All metals are good conductors, because they have many free electrons that can move in-between the atoms, and so therefore a current will flow. A good conductor has a low resistance and a poor conductor has a high resistance. Thin wire within a lamp will resist the movement of electrons that is within it. Therefore we can conclude that the wire has a resistance to the current. The greater the resistance, the more voltage that is required to move a current through the wire.
There are four factors that affect resistance:
- As the length increases, the resistance increases
This fact can be used in a rheostat
- As cross-sectional area increases, the resistance decreases
- Copper is a good conductor and is used for connecting wires. Nichrome has more resistance and is used in the heating elements of electric fires
- As the temperature increases, the resistance of the wire increases
This is used in a resistance thermometer
Therefore the resistance of a wire of a certain material:
- Increases as the length increases
- Increases as the cross-sectional area decreases
- Depends on the material
A long, thin wire has more resistance than a short thick one of the same material. Silver is the best conductor, however a metal like copper is the second best, and it is used in connecting wires because it is cheaper. Resistance is anything that causes an opposition to the flow of electricity in a circuit. It is used to control the amount of voltage and amperage in a circuit. Everything in the circuit causes a resistance (even the wire.) So therefore resistance is anything within a circuit that will slow or inhibit the movement of electrons, and if you increase the resistance then less current will flow.
Measuring Resistance
Resistance is measured in units called ohms ( Ω ). For example, a 10-ohm resistor would have twice the resistance of a 5-ohm resistor. If the current flowing through a conductor is I when the voltage across is V, the resistance R is defined by:
R = V
I
Or: the resistance is equal to:
P.d. across a wire
Current flowing through a wire
Finding the resistance using the current and potential difference is known as the ammeter-voltmeter method.
This circuit will allow you to record the current and the potential difference in Amperes and Volts in order to calculate the resistance:
How this led me to a strong conclusion and supports my original prediction
Therefore as the length of the carbon putty paper increases, the resistance increases, and this increases is directly proportional as no other factors affect these results. Also, one graph shoed that resistance was inversely proportional to area(diameter), as shown in a curve. This is exactly what my prediction stated:
Therefore, it is predicated that the resistance is proportional to the length, but inversely proportional to the diameter.
The results on the table show that the current, in amps, has decreased as the length decreases, resulting in the overall resistance using the formula R =I/V decreasing with the length. As the cross-sectional area of the carbon putty remained the same and the temperature remained constant, this decrease in resistance with the length was directly proportional, and it resulted in a straight line through the origin. My prediction graph stated this shape exactly, therefore my graph agrees entirely with the prediction graph. Of course, not every point passes through the line of best fit, but this does not alter the overall shape of the graph in any way, as these results still followed the trend and allowed me to come to a firm conclusion that completely supports my prediction, based on the detailed scientific knowledge.
Also, when the experiment was repeated with different diameters, the higher the diameter, the lower the resistance as said in my prediction.
I would feel confident about showing these findings to a third party, as my conclusion agrees entirely with my prediction, and what was stated has been achieved.
So, in an overall conclusion, the results have agreed both with the predictions and the prediction graphs. My statements before the experiments were accurately estimated using detailed scientific knowledge, and by doing so I have been able to conclude that carbon putty obeys Ohms Law, and that as its length decreases so does the resistance, and this is directly proportional. In addition, as the diameter increases, the resistance decreases and vice versa . The graphs are accurate and relate to my prediction and the conclusion obtained. This has led me to a strong conclusion and it entirely supports my prediction.
Evaluation
After looking at the method used and the results obtained in the graph I can come to the conclusion that the method enables me to collect data in order to make an accurate evaluation of the investigation:
I believe that the observations and measurement were done with a sufficient accuracy to use in an experiment, and the methods were well planned and suitable, and I can conclude I was satisfied with the results. I was able to make a conclusion that could not only be explained using detailed scientific knowledge, but it was also directly related to my prediction, and agreed with the knowledge and estimated outcome that was suggested.
After observing the graphs and enquiries in the investigation, I can conclude that there is a slight anomalous result on the graph that shows 1cm diameter for the ammeter/voltmeter experiment. This result did not fit the trend on the line of best fit. I will reject this result, as I believe it is entirely anomalous, and it is suitable to do so. Therefore this enables me to have an entirely straight graph that shows accuracy and reliability, and allows me to feel confident about the gradient that is obtained on the graph. I have ignored this point on the graph, and have labelled it anomalous result.
An anomalous result could have occurred for numerous reasons:
- I could have misread either the voltmeter reading or the reading on the ammeter.
- The carbon putty may not have been fitted correctly to the bulldog clips, so that the current was not flowing completely
- The carbon putty’s cross sectional area was not constant throughout, therefore affecting the result.
- The circuit could have been left on for a longer period of time, so that temperature affected the results as the circuit was heated
- One of my results was not recorded using the correct voltage output from the power unit, so there was a different average
- One of the wires was not connected properly to a certain item of apparatus for those particular reading
I am sure that there are more reasons why the slight anomalous result could have occurred; however these are the ulterior reasons that I can think of at present.
I feel that I have no need to repeat the experiments, and my results were good enough to come to a firm conclusion. After removing the one anomalous result, I can confirm that I believe the methods were appropriate, and that the results are entirely accurate in the conclusion, as they fully relate and support the predictions that were suggested using detailed scientific knowledge. I did, however, feel that the multimeter experiment showed a more consistent line of best fit, so that the results were more reliable. I also felt that the Voltmeter was not an entirely accurate item of apparatus, as the results displayed were not constant and wavered quite considerably, as the voltage differed and a rough estimate of the results shown had to be displayed. Therefore if I were to repeat the investigation I would avoid using the voltmeter and ammeter, but just use the multimeter.
One problem I encountered in the multimeter graph was that the line of best fit did not pass through the origin. There must have been some extra resistance in the circuit. As this applied to every result, all I needed to do was to move the line of best until it pass through the origin, shown as a dotted line on the graph.
However, I do not feel that it is necessary to repeat the investigation, as I was able to obtain very reliable and accurate results that fully supported the prediction, and the evidence was sufficient enough to allow me to come to a firm conclusion. I am confident about presenting these results to others in order to show my findings on this particular topic. However, there are always ways to improve the accuracy and reliability of the investigation if it were to be repeated, and also how to improve the method that I have used:
-
Take more repeats in order to obtain a better average and more reliable results
-
Have a larger range of results taken, for example using a larger piece of carbon putty and taking more results from this
-
Try to find a more accurate way of measuring my results, maybe on a computer, and using a digital to analogue converter from a temperature sensor to record the data
-
Do the same experiment with more people, to see if human error or a different technique makes any difference to the experiment
-
Try using a battery pack rather than a power unit, to see if this results in a more accurate experiment
-
Use a digital multimeter instead of the ammeter and voltmeter.
-
Use different apparatus to try and obtain more reliable results, for example using different types of wiring, or eliminate the crocodile clips.
-
Repeat the experiments using the same piece of carbon putty, so that the experiment is repeated with exactly the same conductor, and there are no changes whatsoever, in order to produce accurate results
Additional evidence is something being investigated or measured to show the same thing. To obtain additional evidence that could support my theory on the factors effecting resistance in a conductor, I could do the following:
- Different conductors could be tested to see if they Obey Ohms Law
- Diodes, Filament Lamps and thermistors could be experimented with carbon putty paper to see how they behave in comparison to a linear substance
- Different lengths of materials could be used instead of carbon putty to see if the length increases with the resistance, and see how it differs to that of carbon putty.
- Different voltage outputs from the power unit could be used instead of five volts to see if this applies to different outputs of voltage from the energy source
- A completely different method and apparatus altogether could be used, as there is most likely a way to produce much more accurate results
- Different atmospheric conditions could be used that might increase the chances of finding additional evidence to support my prediction
- A different factor could be observed rather than the voltage and current measured, instead a bulb or motor could be used and see how the electrical or kinetic energy is affected by a decrease or increase in length of the carbon putty.
I believe that my results from the queries within the investigation are accurate enough and sufficient enough to lead me to a firm conclusion. I am completely happy with the results, although I think the accuracy in the experiment was decreased slightly by the inaccuracy of the voltmeter, however this did not prevent me from obtaining results and a conclusion that fully complied with my prediction. Therefore I can evaluate this investigation as a success, and after the removal of the anomalous result I am completely happy with what has been produced.