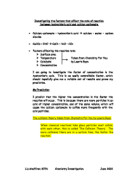
Secondly, I decided what size of marble chips, out of small, medium and large, to use. I decided to use small marble chips, so that the hydrochloric acid can react with as much calcium carbonate as possible. A certain mass of marble chips will have a larger surface area, and if smaller chips are used, their surface area will be larger.
Next, I decided how much hydrochloric acid solution and calcium carbonate (marble chips) to use. I came to my final decision, (50ml of hydrochloric acid and 5g of marble chips) by performing an experiment where I varied the volume of the hydrochloric acid solution and the mass of the calcium carbonate. I used the most and the least concentrated solution of hydrochloric acid, so that I could see what the minimum and maximum time the reaction would occur.
My findings are in the table below:
I decided on using 5g of calcium carbonate and 50ml of hydrochloric acid because the results showed that the longest amount of time it took for this reaction to produce 50cm³ of carbon dioxide would be around 60 seconds, which is satisfactory. The combination of 7.5g of calcium carbonate and 50 cm³ of hydrochloric acid solution would take a shorter time, but wastes more calcium carbonate, because the difference in the maximum time the reaction could take is only about 10 seconds. The former combination is also better because it would allow the results to be more spread than the latter combination. The first reaction would also be easier to record because its lack of speed would allow the results to be more accurate, as it is easy to tell when to stop the time if the carbon dioxide is being produced slowly.
Prediction
I predict that the higher the concentration the faster the reaction will take place this is because in a higher concentration there will more hydrochloric acid molecules per set volume. This means that there will be a higher chance of the calcium carbonate molecules colliding with the hydrochloric acid and reacting. This should increase the rate of reaction as the concentration is increased, but should decrease the reaction time.
I believe this because of the term in chemistry called ‘collision theory’. With an increase in temperature, concentration, surface area or catalytic action, the movement of particles becomes much faster. This enhanced speed increases the likelihood of particles hitting each other. These collisions will increase reaction rates and decrease reaction times. They also release a lot of heat during the process as well.
The reaction rate, however, should decrease as the experiment progresses because as the reaction time increases, the number of hydrochloric acid molecules present will decrease, as they have reacted to form water, calcium chloride and carbon dioxide. The additional water and calcium chloride present as the experiment progresses should decrease the rate of reaction, because of the decrease in concentration. This should make a graph of the reaction curved as the reaction rate slows down.
The increase in the concentration should be directly proportional to the increase of the reaction rate at a given time. This is because by doubling the number of hydrochloric acid molecules present, the chance of a collision should be doubled, as there is now twice the possibility of a collision-taking place.
Activation energy should not be changed in this experiment though as the same amount energy will be required to break the bonds. This is because each particle has the same amount of energy, and the only reason the reaction is faster, is because there are more particles. This means activation energy will not have an effect on this experiment.
Method
Procedure
- Attach a delivery tube to a conical flask.
- Fill a tub with water to produce a water bath.
- Measure out 5g of calcium carbonate on a piece of paper on some electronic scales.
- Measure out 50cm³ of hydrochloric acid solution in a measuring cylinder.
- Fill a 100cm³-measuring cylinder with water and put it upside down on top of a beehive jar in the water bath so that none of the water inside the cylinder escapes.
- Insert the delivery tube through the beehive jar into the measuring cylinder.
- Pour the hydrochloric acid solution into the conical flask.
- Add the calcium carbonate to the solution.
- Insert the bung into the top of the conical flask.
- Start the stopwatch.
- Stop the stopwatch when the amount of water displaced in the measuring cylinder reaches 50cm³.
- Record the time.
- Repeat the procedure 3 times for each concentration of hydrochloric acid in the hydrochloric acid solution.
Diagram
Equipment
Conical flask: This is where the reaction between the calcium carbonate and hydrochloric acid solution will occur.
Bung: This will stop any carbon dioxide escaping when the reaction is occurring inside the conical flask.
Delivery tube: this will be connected to the conical flask and will carry the carbon dioxide to the measuring cylinder.
Measuring cylinder: this will measure the amount of water displaced by the carbon dioxide. A different one will be used to measure out the hydrochloric acid solution.
Beehive jar: this will allow the carbon dioxide to pass from the delivery tube into the measuring cylinder.
Water bath: this will allow water inside the measuring cylinder to be stay there.
Electronic scales: these will allow the calcium carbonate to be weighed accurately.
Paper: this will stop the calcium carbonate from escaping once it has been weighed.
Stopwatch: this will allow the experiment to be timed.
Safety
- Always wear safety glasses during the experiment to prevent any acid entering your eyes.
- Stand up while performing the experiment.
- Tuck in any stools or bags to avoid anybody tripping up over them.
- Tie back your hair and tuck in your tie to prevent them from becoming hazardous.
- Wear a lab coat to prevent any chemicals from coming into contact with you or your clothes.
Results
Tables
The following table shows the average time taken for 50cm³ of water to be displaced at each concentration: -
I then divided 1 by the average time taken to displace 50cm³ of water to give me the values for the reaction rates: -
Graphs
Analysis and Conclusions
From these results, we can conclude that by increasing the concentration of hydrochloric acid, the rate of reaction is also increased. This can be seen as the highest concentration displaced 50cm3 of carbon dioxide in the fastest times (7.16 sec, 6.83 sec and 7.07secs), whereas the lowest concentration only displaced this in 57.5 sec, 63.76 sec and 59.21 sec.
You can also see that the concentration was almost proportional to the reaction rate, as well as almost being proportional to average time taken to displace 50cm3 of water. In fact, the graph that shows the relationship between the concentration levels and the average time taken is one half of the graph x to the minus square. There is a slight margin of error with this conclusion, as when the concentration reaches 80%, the average time taken does not decline as much as it had with the other results.
A similar feature is that on the other graph (with the reaction rates), it almost resembles the shape of an x-squared graph. Yet again though, it breaks from the trend when at 60%, increases by a larger value than the value needed to keep this rough pattern going.
Evaluation
The results from the experiment showed that my prediction was not completely supported, because the reaction rate did not slow down. My thoughts on the reaction rate are that if there were intervals, at which I measured how much carbon dioxide had been displaced, were used, then my prediction may have come true.
It could not be fully determined whether the increase in concentration would increase the rate of reaction whether we continued this experiment with much larger figures. This could be found out by extending the range of concentrations that could be reacted with calcium carbonate. This experiment would have to be conducted very carefully as hydrochloric acid at high concentration can be very dangerous, and the fact that a lot more time and preparation would have needed to be taken to maintain the levels of safety.
The method showed the relationship between the concentration and the rate of reaction, but there was a slight margin of error because turning the cylinder upside was such a delicate operation, that it was very difficult not to lose some water. To solve this problem we could use a gas syringe, but the difficulty with this is that we could not test the higher volumes of gas, which would mean the range of results would be lower. This would lead to us withdrawing a less formulaic pattern.
The experiments were fair tests but there was a margin of error because the scale with which we recorded our results was not precise enough (to 1 cm3), and the values of the controlled variables were not the exact amounts, thus giving us false results and misinterpreted formulae.