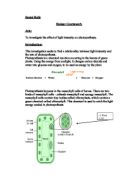
I know photosynthesis is made up of two reactions one is light independent and one light dependent. Light dependent reaction splits water by photolysis and forms ATP (the energy carrier). The process occurs in specialised chloroplasts made up of chlorophyll and carotenoids. They are most efficient in blue/violet and red light and reflect green explaining why leaves are mainly green.

AIM
I plan to make a controlled comparison on the abundance of violet growth between a recently coppiced woodland and an older coppiced woodland, relating to the variable light.
HYPOTHESES
I predict the 6 year old coppiced land will be more abundant in violets than the 10 year old coppiced land. I can see this in my preliminary study (pg ) where the total of violets found in the 10 quadrats of the 93 plot was 100 but the total violets found in the 97 plot was 149. This was significantly more in the 97 ...
This is a preview of the whole essay
AIM
I plan to make a controlled comparison on the abundance of violet growth between a recently coppiced woodland and an older coppiced woodland, relating to the variable light.
HYPOTHESES
I predict the 6 year old coppiced land will be more abundant in violets than the 10 year old coppiced land. I can see this in my preliminary study (pg ) where the total of violets found in the 10 quadrats of the 93 plot was 100 but the total violets found in the 97 plot was 149. This was significantly more in the 97 plot than in the 93 plot. The 93 plot was also quite abundant in other species like self heal and archangel.
Although violets are shade-loving plants they still require light to drive photosynthesis. As stated earlier, photosynthesis involves two reactions light dependant and light independent. When light intensity increases so do the reactions. Light independent reactions will speed up too because it requires ATP (used in the Calvin cycle), which is synthesised in the light dependant reaction. As more reactions take place growing processes increase too and allow for increased reproduction. The increased reproduction should show in my data increased abundance. I was told violets grow in bunches around each other so offspring will grow around parent plant. If I refer back to my preliminary study the 1993 subset had an average light intensity of 3000-4500 lux while the 1997 subset had readings of around 8500 lux. Therefore due to this fact and the earlier knowledge I predict subset 1997 to be more abundant in violets than subset 1993.
Growth depends upon photosynthesis and photosynthesis can only happen when there is light energy. Plants contain a chemical called auxin that is present in the growing areas the shoots and roots. Gibberellins and abscisic acid are growth regulators whose part of the job is to control height. Gibberellins are secreted by starch being mobilised to form maltose. Starch is produced by photosynthesis. Therefore the more light there is, the more photosynthesis there will be, the more auxin and plant hormones are produced, the more growth there will be overall and therefore the quicker the plant can reproduce. Increase in rates of transpiration caused by sunnier areas and the opening of stomata calls for more water and carbon dioxide in the plant. The more of water and carbon dioxide are required the more photosynthesis will take place. Since and increase in the rate of photosynthesis increases the growth rate of plants, in this case violets, I can expect the sunnier the plot will be the more violets there will be.
APPARATUS
10 Point quadrat
Light intensity meter (lux)
Tape measure
Random numbers
In order to obtain reliable results, accurate and appropriate apparatus should be used.
I chose to use a point quadrat because it has pin point accuracy providing a reliable result. As violets would be the abundant species it seemed appropriate to use this. Unlike the square quadrat there will be no or little chance of me counting the same violet twice.
The tape measure is a suitable way of measuring an area as its accurately scaled. It is also easy to read when having to move to a co-ordinate.
I have decided to use a light intensity meter as it is the easiest and most accurate way to measure light. I will not use the plastic lid to cover the light intensity meter as I did in the preliminary study as the day today is in natural light. The readings will therefore be moved up to a different scale to the preliminary study light readings.
Measurements
The total light in the area, which is 7730 lux. I can now find the percentage light intensity:- n/7730 * 100.
30m X 30m area
SAFETY
A lot of bramble is on the ground so I should be careful when walking as they can be quite prickly.
The surveyor’s arrows on the point quadrat are very sharp so I should be careful when using it.
FAIR TEST
The numbers should be completely random to prevent being bias so that there is an equal chance of everything being chosen.
The Light meter should be used fairly in each case, making sure nobody’s shadow is in the way
The point quadrat should be placed in the same position every time (parallel to one axis)
Co-ordinates should be reached as accurately as possible.
The tape measures must be placed as accurately as possible at a perpendicular angle.
The probe of the light intensity meter should be placed at the same depth throughout.
Read the intensity straight away so as not to allow any blockage e.g. person’s shadow.
As I am in open area it is difficult for me to control all other variables. Limitations such as oxygen concentration, carbon dioxide concentration, humidity, water content of soil are all out of my hand, but in a manageable environment I would have controlled. In a small area I would have ensured each area to be equal quantities of all limiting factors except light intensity. Nevertheless, for the investigation I am carrying out these other variables will not immediately change violet growth if I was able to control these other factors at the time of my investigation.
METHOD
- I placed two tape measures at right angles and stretched each for 30M in order to cover a 30X30M
- I located my first co-ordinate on the random numbers list.
- The point quadrat was placed parallel to x-axis and I counted how many hits there were
- Probe of light intensity meter was placed in the soil and read.
This method is uncomplicated and did not interfere with any other limiting factors of photosynthesis such as humidity or temperature.
RESULTS
I collected 30 samples of data for each subset. Here is the results table.
Table for plot 1993 plot Table for 1997 plot
*Va=Violet abundance
OBSERVATIONS
From this table I can deduce that the 1997 plot had more than twice the violets than the 1993 plot. The highest percentage of abundance found in the 10 year coppiced plot was 80% (quadrat no.13). However, the highest found in the 6-year coppiced plot was100% abundance in four occasions (quadrat no. 4,5,11,30).
CONCLUSION
As can be seen in the 1993 subset most of the percentage cover ranges from 0-50%, while in the 1997 subset it is mainly in the 60-100%. Although the 1997 graph shows only 10% as its mode this can be explained due to the extremely low amount of light and the type of light reaching the ground in many places. The main reason in a lot of places in the 97 plot was fern. It grew in large expanses and was not just concentrated in one area. Very low intensity light was measured here. Fern and other plants growing up to the herbaceous layer acted as a selective filter. A lot of the light filtered was a greenish colour. As I stated in my introduction chlorophyll and carotenoids mainly absorb light at the two ends of the spectrum the red and blue. Chlorophyll a and chlorophyll b both reflect green light. Therefore this kind of light reaching the chloroplast will not be absorbed so readily. I think this is why violets were not able to grow as readily due to these conditions.
Oak trees acted as niches which I expect also helped violets to grow. A lot of the time I observed violets in a group at on one side of a tree. This could depend on shade or rich soil. However as this was coppiced many trees had only started to grow. There is also competition of other plants that will occupy the space in order to get food and water. This could lead to a succession of other species that were not originally there.
It can be observed particularly by the line of best fit that there is a positive correlation between abundance of violets and light intensity. This supports the acceptance of the alternative hypothesis that there is a relationship between light intensity and the violet abundance. I used Excel to calculate the correlation co-efficient of this scatter graph and r=0.783257. This is a very high positive correlation showing a strong relationship.
I knew that shade loving plants such as violets had low compensation points so they did not need to carry out as much photosynthesis as other sun loving plants. In addition I found out that their saturation points were low which is the point were no further light will produce further growth. The flat round shape of leaf could capture as much area on which light may fall a possible. The palisade cells that contain chloroplasts were able to use the maximum quantity of light to allow maximum rate of photosynthesis. Thylakoid membranes arranged in grana, increase the surface area too so that more metabolic reactions can take place. By carrying out this investigation I wanted to see that although violets had low compensation and saturation points, was light a limiting factor and just how significant it would be. The graph above proves light was a limiting factor. The greater the light intensity was the greater the abundance there would be.
Statistical tests
My two sets of data display a normal distribution. I want to compare the means of the two subsets in order to find any significance of my data. Therefore I will carry out a t-test.
My data is unmatched, as the two sets of data are not related at all.
T-test formula =
The t-distribution table
I have (N + N )-2) = (30+30-2) = 58 degrees of freedom. This lies between 40 and 60 degrees of freedom. It did not really matter which one I looked at, as the t-value was greater than both at 0.001 probability. This makes it more than 99.999% probable. A significant result at the 99.999% probability level tells us that my data is good enough to support a conclusion with 99.999% confidence. The null hypothesis (Hο) states that there is no relationship between the factors and that the means should be similar. However, the contrary is shown and there is a great difference in mean. The null hypothesis is rejected at the alternative hypothesis (Hı) is accepted. The alternative hypothesis, that the theory is affected by the factor light is further supported in the correlation co-efficient r=0.783257 of the scatter graph previously.
EVALUATION
I think I carried out the experiment in the most appropriate manner with the greatest degree of accuracy possible. Apparatus was the most accurate I had therefore producing reliable results. My aim was to look at the abundance of violets in two different coppiced areas studying light as a factor. The method proved to be suitable as I was able to carry out the whole investigation in one day in equal lighting.
I did encounter many anomalies such as the fact most area in the 97 plot had only a 10% coverage. Also, I had expected quadrat no.14 of the 97 plot to have more than 10 %. As the scatter graph shows there were three results that were around 70 % light intensity but had only 1 point on the quadrat (10%).
Even though I had stated in my fair test to make a reading as soon as I place the probe in the soil I realised that trees were swaying above that were actually affecting the light intensity reading. The reading kept changing continuously so some of the light intensity readings may be incorrect. Other plants also formed shadows, which I should have taken into account because they would affect the light falling on the violets’ leaves. However I had ensured the meter was above most plants in the herbaceous layer that would be the cause of shade. I should place the meter perpendicular to the plant and at the similar level as the leaves. This will provide the truest light intensity falling on the leaves where it is absorbed mainly.
The main problem was blocking of light and I should have investigated further into it.
Sometimes logs were in the way and I was not sure whether to move them as I did not know how long they were there and whether they could have affected the light intensity. However results were still quite reliable as the light meter was very sensitive so showed the exact lux reading. Putting light into a quantitative form made it much easier to compare and draw conclusions from. The point quadrat proved to be quite reliable as sometimes there was a lot of violets which would easily have been counted twice but because the points were at distances there was no chance of this happening.
It was virtually impossible to reach some places because of closed off areas or thick bramble and shrubs. I could tell these areas were not part of the coppiced area because there were no tree stumps. I should have covered another area of 30 X 30 M to get more fruitful results. In addition as a control I could have taken some readings of other factors like humidity and soil pH in an similar area (a 1995 coppiced plot) just to see there were no bizarre readings that could be the sole cause of my anomalies and not the light. I must also take more readings, at least 60 each to double the accuracy.
My results were very significant where t-test value = 3.90 (2.d.p) making the conclusion 99.999% certain. Due to its high significance anomalies are invalidated and do not affect the conclusion I made. Statistically Hı: p>0 and Hο: p=0. We can see clearly that 0.783 is above 0 that shows the alternative hypothesis must be accepted and also there is a high positive correlation between the bivariate data (light and abundance). It is very certain that the fact light will not have a relationship with violet abundance will always be rejected in this coppiced woodland environment.
Hina Moazzam
BIBLIOGRAPHY
Advanced Studies, Biology 1 Letts AS Biology
Advanced Studies , Biology 2 Natural Woodland Ecosystems
www.psc.ac.uk/Training/ILT/materials w22_id_auto.htm