The effect of inorganic ions on the rate of photosynthesis.
In the absence of certain inorganic ions, such as iron, chlorophyll cannot be synthesised. Other ions, like nitrogen and magnesium, are an integral part of the chlorophyll molecule and their absence likewise prevents its formation. ‘Where plants are grown on soils deficient in any one of these minerals, the chlorophyll concentration is reduced and the leaves become yellow, a condition called chlorosis’7. Under these circumstances the rate of photosynthesis is substantially reduced.
Other factors also affect the rate of photosynthesis, such as water and specific chemical compounds. A deficiency in water will clearly reduce the rate of photosynthesis. Water has so many functions in a plant that it is impossible to directly relate its availability to the rate of photosynthesis. There are many specific chemical compounds that prevent photosynthesis, often by inhibiting enzyme action. ‘Examples include cyanide and dichlorophenyl dimethyl urea. Even certain pollutants such as sulphur dioxide are known to reduce photosynthetic rate’8.
Hypothesis:
Increasing the concentration of NaHCO3 will increase the number of bubbles emitted. This is because background knowledge shows that by increasing the amount of carbon dioxide present directly increases the rate of photosynthesis.
Increasing the temperature will directly increase the number of bubbles emitted, as the rate of photosynthesis increases with increasing temperature due to higher enzyme activity.
Variables:
Variables include:
· Length of Elodea- the larger the plant the larger the surface area hence more area for uptake of carbon dioxide, therefore an increase in the rate of photosynthesis. In order to prevent this interfering with the reliability of the results this variable must remain constant throughout the experiment.
· Distance of lamp- artificial light produces heat that will increase the temperature so it must remain at such a distance that will not affect the temperature of the environment.
· Time spent counting- whilst the number of bubbles are being recorded the plant is still photosynthesising, so these new bubbles will not be recorded, therefore to eliminate this error one person will have to record the results whilst the other person observes the number of bubbles being released.
Method:
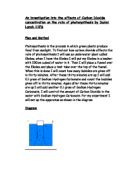
The effect of carbon dioxide on the rate of photosynthesis.
-
Fill the beaker with 800cm3 of water.
- Select 1 or 2 pieces of pondweed each roughly 10 cm long and cut off the stems.
- Place the pondweed in the glass beaker and secure the funnel upside down over (on top of) the pondweed using the plasticine.
- Place a water-filled test tube upside down and over the funnel.
- Record the number of bubbles emitted after a 3 minute duration.
-
Repeat the experiment but add 600cm3 of water and 200cm3 of the 0.05M solution of NaHCO3 instead of 800cm3 water. By doing so the concentration of NaHCO3 is being altered from the original 0.05M to a 0.0125M solution.
-
Use different concentrations of NaHCO3 by mixing with water. To get a 0.025M solution mix 400cm3 water with 400cm3 NaHCO3 solution. For a 0.0375M solution mix 200cm3 water with 600cm3 NaHCO3.
- Record all results in a suitable table for later analysis.
Remember to keep the temperature constant throughout the experiment.
The effect of temperature on the rate of photosynthesis.
-
Fill a beaker with 400cm3 water and 400cm3 of NaHCO3.
- Select 1 or 2 pieces of pondweed each roughly 10 cm long and cut off the stems.
- Place the pondweed in the beaker and secure the funnel upside down over (on top of) the pondweed using the plasticine.
- Place a water-filled test tube upside down and over the funnel.
-
Set the temperature to 10°c, using ice or a Bunsen burner to keep the temperature constant.
- Record the number of bubbles emitted after 2-minute duration.
- Repeat the experiment, at that temperature, 3 times to gain an average.
-
Again repeat the experiment but alter the temperature, increasing by 5°c so that there is a range of temperatures from 10°c to 35°c.
Remember the concentration of NaHCO3 must remain constant throughout this experiment.
Risk assessment:
- Wear safety goggles and take care when handling chemicals, such as NaHCO3 solution, to prevent any foreign particles from entering the eye.
- Tie long hair back if using Bunsen burner to prevent obstruction of sight, and to prevent accidents.
- Care should be taken when handling the sodium hydrogen carbonate solution as it maybe irritating to eyes and skin.
- Take care when handling the Bunsen burner as you may burn yourself.
- Do not sit down during the experiment, especially when Bunsen burners are alight, and keep all chairs/stools out of the way as these will slow down reaction time, in case of an emergency.
- Care should be taken when handling the scalpel, as it is a sharp object and can cause injury if mishandled.
- Take care when handling the beakers after heating the contents, as they may be hot.
- To avoid accidents, wipe any spillage immediately and maintain organization throughout the experiment.
- While the Bunsen burner is not in use ensure that the safety/yellow flame can be seen.
Results:
Tables showing the volume of O2 produced at different concentrations of NaHCO3 and different temperatures.
Table showing the average volume of oxygen produced at different carbon dioxide concentrations and different temperatures.
Analysis:
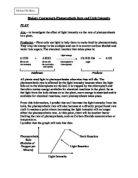
Analysis of the results shows that From the results that I have gathered I can state that an increase in light intensity certainly does increase the rate of photosynthesis. As was also expected in my prediction, the relationship between light intensity and the rate of photosynthesis was non-linear. From both graphs there is a best-fit curved line. This means that the rate of photosynthesis increases at an exponential rate.
However, my prediction that light intensity is inversely proportional to the distance squared did not fit into my results perfectly. The rule existed but there was often quite a large margin of error.
When measuring light intensity in terms of distance, the greater the distance, the slower the rate of photosynthesis. While the rate of photosynthesis was decreasing, the rate at which it was decreasing at was also decelerating. This is where the line in graph 1 shallowed.
When measuring the light intensity in terms of LUC, the greater the distance, the slower the greater the rate of photosynthesis. While the photosynthetic rate increased, the rate at which it increased was decreasing. This is where the line in graph 2 shallows.
The shallowing of the line in graph 1 can be explained by the fact that light intensity is inversely proportional to the distance squared. This means that as distance increases the light intensity decreases at an exponential rate. If light intensity decreases exponentially, photosynthetic rates that depend on light intensity also decreases exponentially. The line in graph 1 would eventually reach "0" where photosynthesis stops as light intensity limits this rate.
The shallowing of the line in graph 2 is due to other factors limiting the rate of photosynthesis. These other factors do not immediately limit the rate of photosynthesis but rather gradually. As light intensity increases the photosynthetic rate is being limited by certain factors such as carbon dioxide and temperature. As light intensity increases further, these factors limit the rate of photosynthesis even more until photosynthesis is completely limited and the graphed line become horizontal. This is when photosynthesis is being carried out at a constant rate.
Evaluation:
A large factor in determining data accuracy is the amount of human error during experiments. The rate at which oxygen bubbles were being produced by the plant was so high that it was difficult to count the number of bubbles.
To improve the accuracy of the results, the readings would have to be taken several more times. A larger range would improve the overall reliability of the results, as it would eliminate some of the systematic errors.
There are quite a few factors that could affect the results of the experiment. Some of these are variables that were mentioned earlier and could not be controlled, or even variables that were not initially considered.
While performing the experiment, some of the oxygen produced from photosynthesis may have dissolved into the water. Microorganisms living on the pondweed may have used some oxygen. Although the amount of oxygen dissolved or used by microbes may be insignificant to the final result, when considered alongside the other variables this factor may be attributed to a significant change in the results. Some oxygen is also used during the respiration of the plant.
As only the volume of oxygen produced was recorded the change in bubble size was not accounted for when the results were analysed.
For a more accurate analysis of the data, using a capillary tube in place of the test tube so that the size and volume of each bubble could have been measured would have eliminated this inaccuracy.
There are also factors affecting accuracy at low light intensities. With low light intensity, the pondweed receives some light energy from background light such as sunlight seeping through curtains or the light from the lamp of another student's experiment. To eliminate extra artificial light from interfering with the results, the experiment must be performed in a completely dark room.
The methodology of the experiment is also likely to account for any errors made, so in order to improve reliability and validity of the results some methodological features must be improved upon or changed completely. A capillary tube and a syringe should be used in place of the test tube to accurately measure the volume of the oxygen produced. Due to the high rates of photosynthesis of the pondweed, readings should be taken within shorter time periods. Doing so decreases the likelihood of human error occurring.
Due to the nature and convenience of the experiment, it could be easily modified to investigate other variables of photosynthesis. An experiment using almost identical apparatus would be to vary the colour of the light the plant absorbs. Using translucent colour filters in front the lamps could vary this.
Whilst doing the experiment several times contributed to the accuracy of the experiment, there were factors that detracted from it. The method of measuring the rate of photosynthesis by the frequency of bubbles was one. The volume of the bubbles could have varied, meaning that a larger or smaller amount of oxygen could have been released without being recorded.
To eliminate these errors, using apparatus like a micro-burette or some other tool for measuring small volumes of gas may overcome small inaccuracies. This would make the results more accurate and reliable.
Modifications:
Limitations.
- The room temperature may fluctuate.
- The concentration of carbon dioxide in the water may be reduced during experiment.
- The rate of gas evolution is not consistent.
- There are other light sources, which may interfere with the results.
- Artificial light will increase temperature, as a 60watt bulb will be used, some energy will be lost as heat energy.
- Are the bubbles being observed actually oxygen?
Setting up the apparatus and placing it in a water bath may overcome the first error. Doing so will ensure that a constant temperature is maintained throughout the experiment.
To avoid other light sources interfering with the experiment shelter the apparatus up so that the pondweed only receives light from the table lamp.
To ensure consistency of gas evolution when changing to a new condition, the plant should be equilibrated for at least 10 minutes before taking any readings.
Using a dilute sodium hydrogen carbonate solution ensures a constant supply of carbon dioxide to the pondweed, avoiding fluctuation of carbon dioxide concentrations.
To test for presence of oxygen simply lower a glowing splint into the test tube containing the gas; if the splint relights this indicates that oxygen is present. Using this test increases reliability of the results.
The presence of the lamp may cause the temperature to increase; to prevent this from happening ice can be used to maintain a constant temperature.
Further experiments could be implemented to test other factors that may have an affect on the rate of photosynthesis. Light intensity has been found to have an affect on photosynthesis. This can be investigated by placing a light at varying distances from the elodea plant and recording the number of bubbles produced. Other experiments in this area could also include testing the rate of photosynthesis with different amounts of chlorophyll in the plants.
References:
1, 2, 3, 7 and 8 Glenn and Susan Toole, (1999) Biology for Advanced level.
Stanley Thornes pg. 282-5.
4, 5 and 6 D.O.Hall and K.K.Rao, (1992) New studies in biology, Photosynthesis. Cambridge University Press, pg 13-14.