-
These data was plotted on a displacement-time (x-t) graph.
- The velocity was found at suitable points on the x-t graph by working out the slope of the curve.
-
A velocity-time (v-t) graph was plotted.
- The acceleration was found at the suitable points on the v-t graph by working out the slopes. The corresponding displacement was also found.
-
A displacement-acceleration (x-a) graph was plotted.
- The graph was commented in the following part of this report.
Result
Discussion
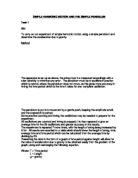
In the experiment, the string used is 1.5 m and the mass was pulled 12.6 cm away from its equilibrium position. Therefore, refer to the diagram below, L = 1.5 m and x = 0.126 m.
In the diagram,
Refer to the displacement-acceleration (x-a) graph, the line plotted is a = -constant x + c where constant is 2.3 and c is 0.7. The line does not pass the origin but cut the y-axis. It is different from the theoretical one a = -constant x. However, this will not affect the slope of the line. The angular velocity (ω) found will not be affected. It will only affect the y-intercept of the graph.
In the above graph, , the negative sign indicates that acceleration is always at an opposite direction to displacement and is directed to the equilibrium position.
a = -constant x indicates that acceleration is directly proportional to displacement.
Also consider the constant in the theoretical graph and the experimental graph.
The theoretical one,
constant =
The experimental one,
constant = slope of line =2.3
There is a large difference between the two values. The percentage error is
The reason for such a large percentage error will be discussed in ‘Error analysis’ of this report.
Since the oscillation has been proved as a simple harmonic motion in ‘Theory’ of this report, the angular velocity (ω) can be calculated.
Comparing a = -ω2x with the displacement-acceleration (x-a) graph plotted ,
The period (T) can also be found,
But when we refer to the displacement-time (x-t) graph, period (T) is
Also consider the period (T) obtained by theory,
We can see that there is an obvious difference between the values of period (T) obtained from the displacement-acceleration (x-a) graph and the theoretical value while the value obtained from the displacement-time (x-t) graph is similar to the theoretical one.
The reason for this will be discussed in ‘Error analysis’ of this report.
Refer to the displacement-time (x-t) graph, we can see that the curve is not so smooth during 0.05 - 0.15s. The slope between this time interval is small. The velocity of the mass decreased when comparing with the time interval 0 - 0.05s.
This will be explained in ‘Error analysis’ in this report.
Comparing the displacement-time (x-t) graph with the velocity-time (v-t) graph, we can see that the velocity-time (v-t) graph leads the displacement-time (x-t) graph by .
It should be note that the angular displacement (θ) used is smaller than . If not , the pendulum will not perform simple harmonic motion. The amplitude will not be independent of its period. The theory stated in the second part of this report can not be applied.
Error analysis
In this experiment, there are a number of errors that resulted in the large difference between the experimental values and the theoretical values.
It is difficult to obtain the slope at suitable position of the displacement-time (x-t) graph and the velocity-time (v-t) graph. The values obtained are not accurate. Thus the points plotted on the displacement-acceleration (x-a) graph are not on the same straight line. The straight line plotted on the graph is just the approximation. Therefore the experimental value of angular velocity (ω) and period (T) differs from the theoretical value. In fact, the large error mainly comes from the plotting of the displacement-acceleration (x-a) graph. In discussion, we have seen that the result from the displacement-time (x-t) graph is similar to the theoretical one but the result from the displacement-acceleration (x-a) graph is different from the theoretical one.
When releasing the pendulum bob, an external force was given to the bob by the hand. The bob oscillated when it was performing its motion. Therefore the curve of the displacement-time (x-t) graph is not smooth.
Because of air resistance, the pendulum bob did not perform perfect simple harmonic motion. The air resistant force acted as a damping force to the oscillation. Some energy was lost.
The frictional between the ticker-tape and the ticker-tape timer also acted as a damping force to the oscillation. Some energy was dissipated as workdone against friction.
After the pendulum reached its highest position, it moved backward and so as the ticker-tape. The ticker-tape timer plotted dots again on the tape. Some dots were overlapped.
Improvement
- It is better to use a computer to detect the motion and to analyze the result obtained. Analyzing the data by hand produces a large error.
- We should be sure that our hands do not give an external force to the pendulum bob when releasing it.
- The experiment can be done in vacuum to avoid the effect of air resistance.
- In fact, it is impossible to eliminate the friction between the ticker-tape and the ticker-tape timer. The only thing we can do is to be sure that the oscillation and the ticker tape timer are on the same plane. This can minimize the friction.
- We have improved the overlapping of dots during the experiment by switching off the ticker-tape timer immediately after the pendulum bob reached its highest point.
Conclusion
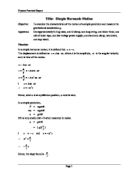
From this experiment, we know that the acceleration and displacement of a simple harmonic motion is directly proportional to each other. Also, the acceleration is always opposite to displacement from the equilibrium position.
However the experiment just shows that acceleration and displacement is directly proportional to each other and acceleration is always opposite to displacement from the equilibrium position. It cannot show the exact relationship between them. ()
To conclude, I am not so satisfy with the result obtained in this experiment, as the error is very large.
Displacement-time (x-t) graph
Velocity-time (v-t) graph
Displacement-acceleration (x-a) graph