Hypothesis
I believe that the less concentrated the Sodium Thiosulphate the slower the rate of reaction will be. I say this because the less the concentration the less the amount of particles in the same volume and therefore the less collisions. This means that the rate of reaction will be slower.
Plan
To obtain our results we will be using the following equipment:
Conical flask (To contain the liquids whilst the reaction is taking place.)
Pipette (To move reactants and measure out precise amounts.)
Goggles (As we are using acid our eyes must be shielded from harmful materials)
Apron (To protect the clothes and body.
Stopwatch (To count the time taken for the reaction to take place.)
Piece of paper with cross on it (To determine cloudiness of liquid.)
The only thing that is going to vary in this experiment is the concentration of the Sodium Thiosulphate. All other chemical volumes and concentrations will remain the same as will the surrounding temperature. The original concentration of the Sodium Thiosulphate is 40g per litre. The concentration of Hydrochloric acid will remain at 1M. We will take a conical flask and place it over a cross on a piece of paper. Then we will add the right amount of reactants based on the table below. To find concentration you divide the new amount of Na2S2O3 by the total volume of Na2S2O3 plus water (50)then you times by 40.
The varying levels of Na2S2O3 and H2O will be measured out in measuring cylinders. The two reactants are then transferred into the conical flask. The stopwatch is started at zero when the HCl is tipped into the conical flask. An observer looks down the conical flask at the cross on the piece of paper. To make sure that the test is fair and consistent the same observer is used each time. The stopwatch is stopped when the observer signals that the cross can no longer be seen. This ensures that the test is done up to the same point of cloudiness every time. The time is recorded in a results graph that looks like this:
As you can see the average will be taken from three returned results. This increases the reliability of the results. Anomalous readings can be easily spotted and commented upon. We have chosen five different concentrations for a greater spread of readings. This makes it easier to evaluate the results and come to a conclusion. To make the test fair all other variables such as temperature will be kept constant, the same person will observe the reaction each time, the total volume in the conical flask will be kept the same and 5cm cubed of the same HCl will be used each time. We have to remember though that some variables (such as temperature) are very hard to continuously control but dramatic changes are not expected. Inaccuracies may possibly be caused by the limitations of humans and equipment during measuring and in making the judgement that the cross is no longer visible. The mean averaging of the results combats this. To ensure our safety goggles and aprons are always worn to protect the eyes and body.
Results
We discounted 42.19 seconds from the mean average of the last experiment because it is too vastly different to the other results in that particular experiment. It has a scientific error of 55.96% and this is too big for it to be reliable. We did the experiment again and got a much more expected result.
Conclusion
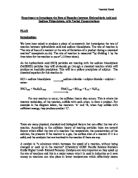
This is a rate of reaction table. The table shown in the results section is a table of how long the reaction took. This table shows how quickly the reaction was taking place and how much of the reaction had been done each second
We can see from these graphs and tables that my hypothesis was in fact correct. As the concentration of the Sodium Thiosulphate decreases the rate of reaction also decreases. The rate of reaction is inversely proportional to the time taken for the reaction to be completed and the concentration of Sodium Thiosulphate. As the concentration of Sodium Thiosulphate decreases so the length of time the reaction takes to be completed increases. This is because as the Sodium Thiosulphate becomes less concentrated it contains fewer particles that can react with the Hydrochloric acid. This means that there is a reduced chance of collisions and therefore the rate of reaction will fall as is stated in the collision theory.
The line of best fit in the rate of reaction (rounded 1/time X 1000) vs. Thiosulphate concentration graph is a straight line with a positive slope and is therefore increasing at a constant rate .The line of best fit on the time taken for the reaction to completed vs. concentration graph is also a straight line but with a negative slope showing that there is a steady decrease in the time for the reaction to be completed as the concentration of thiosulphate increases.
I predict that if we continued increasing the concentration of thiosulphate a point will be reached when the rate of reaction will not increase any further but will stay constant. This is because there are not enough HCl atoms to collide with the excess thiosulphate atoms.
From a concentration graph we can see how the increase in concentration affects the number of particles with enough activation energy. This is the required energy for the reaction to get started. Below this energy level the particles do not have enough energy that when they collide a reaction occurs.
Increase the concentration and you get more collisions due to more particles and more particles with the required activation energy and so the rate of reaction increases.
In conclusion, the rate of reaction is inversely proportional to the time taken for the reaction to be completed. The rate of reaction decreases as the concentration of thiosulphate decreases because there are fewer particles to collide and fewer particles with enough energy to react.
Evaluation
My method went relatively well. Most of the results that we obtained fitted in with our prediction. There were a few anomalous results, the most obvious being the 42.9 seconds that was found in the last experiment. We believe that this was caused by an amount of leftover HCl being left in the conical flask and speeding the reaction up. We decided to leave this result out of the final mean value and the graphs. The other possibly anomalous result is the final mean result of the 5th experiment. If you look at the rounded mean result in seconds graph you can see that the line of best fit does not go near this mean result of 75 seconds. This is probably because of the lower ambient temperature on the day that we did this experiment that caused a slower rate of reaction and so increased the time taken for the experiment to finish. . If I did the experiment again I would try to do all the experiments in the same day. This would make the ambient temperature more constant and therefore the temperature would affect the results equally.
Another possible source of error was difficulty in judging when the cross disappeared. Possibly we could measure the rate of reaction by collecting the sulphur dioxide produced.
Overall, however, we followed the stated method for each of the experiments and I believe that it went quite well and it gave a good set of results that display the predicted pattern for this experiment. It supports my conclusion because it shows that the time taken for the experiment to finish is inversely proportional to the concentration of Sodium Thiosulphate.