They take carbon dioxide from the air. Plants use sunlight to turn water and carbon dioxide into glucose. Plants use glucose as food for energy and as a building block for growing. The way plants turn water and carbon dioxide into sugar is called photosynthesis. That means “putting together with light”
During the winter, there is not enough light or water for photosynthesis. The green chlorophyll disappears from the leaves. All plants need light in order to photosynthesise. Photosynthesis can only occur in the presence of light.
Hypothesis: The brighter the light intensity the more bubbles that will be produced. As the light is increased so would the rate of photosynthesis.
Apparatus: boiling tube, 250ml beaker, bench lamp, ruler, sodium hydrogen carbonate, pipette, elodea, tally counter and a stopwatch.
Method:
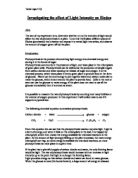
- Put the pondweed in the boiling tube with the pondweed water in it that it was taken from covering in because the plant is not used to tap water.
- Put the boiling the tube in a 250ml beaker filled with cold water and shine the bench lamp on it.
- Leave it for about 5 minutes so it can adjust to it’s new surroundings
- Using a spatula sprinkle a bit of sodium hydrogen carbonate into the boiling tube to provide carbon dioxide for the plant.
- Take the temperature of the plant by placing the thermometer into the beaker to see if the elodea is at a temperature where it would not be affected by enzymes .
- Count the bubbles at one-minute intervals as they appear using the tally counter to record the results.
- Repeat the experiment but moving the bench lamp 5cm away each time after 1 – minute intervals to make it a fair test.
Preliminary results:
Table of results to show how many bubbles were produced per minute at 32°
1.
2.
3.
Averages for the results of the experiment:
Experiment 1: 61.3
Experiment 2: 82.1
Experiment 3: 55.3
Averages for the results of the experiment:
Experiment 1: 61.3
Experiment 2: 82.1
Experiment 3: 55.3
Averages for each measurement in the experiment:
Analysis: The rate of photosynthesis increases as the light intensity increased. This is because photosynthesis is a reaction, which needs energy from light to work, so as the amount of energy available from light increased with the rise in light intensity, so did the amount of oxygen produced as a product of photosynthesis.
My graphs showed the relationship between the light intensity and the rate of photosynthesis was non linear. In the very first part of the graph, the increase in rate is proportional to the increase in light intensity.
I can say that an increase in light intensity does increase the rate of photosynthesis.
My preliminary experiment was not accurate enough to justify being used as my main experiment because I was depending on all the bubbles to be the same size, which they were not. Anomalous results could of also been caused by my counting at a certain angle that would not allow me to see every single bubble as they rose to the surface or the bubbles could have been caught up in the leaves giving us an underestimate of bubbles produced.
Using a tally counter helped to count the amount of bubbles that rose. It was a better method than plotting dots on a piece of paper every time a bubble rose because a dot may be accidentally put on top of another.
The graphs showed that the further away the light the less bubbles were produced. To get a better graph or set of results the experiment could have been tested.
The results could be like this because the plant could of run out of carbon dioxide.
Another error could have been the distance between the light source and elodea were not measured to a high degree of accuracy.
Overall I think the experiment went well and although the results varied it turned out ok!