Surface area of the catalyst is not a good variable to use because it is extremly hard to get a numerical value for the surface area of the catalyst – which makes plotting a graph impossible. This would make analysis of the results very difficult.
Atmospheric pressure is unsuitable for a school laboratory experiment. It requires expensive, specialist equipment which is unavailable.
Mass of catalyst is unsuitable as it requires extensive knowledge about catalysts and their effects, and it has still not been openly decided what the effect of mass of catalyst is.
Volume of H2O2 did not affect the preliminary experiment results hugely (apart from final amount of O2 gas given off) and so it is most probably not suitable as a variable.
As all of the above variables are not suitable to be used as input variables (this was decided using the preliminary investigation and through own knowledge), concentration of H2O2 was chosen as the input variable for the main investigation. It has clear theory to explain the relationship, and the results will be numerical so will be able to be plotted on a graph, but also the experiment is practical for a school laboratory investigation as it is not too expensive.
Preliminary Investigation
This was done in order to sort out an appropriate range of values (and if check readings were needed), which method and apparatus was more suitable for the experiment, what quantities of each substance were needed and to determine which variable would be most practical to use as the input variable.
Method
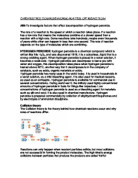
The experiment was originally set up measuring rate of reaction by collecting the amount of oxygen gas produced, in order for volume collected to be plotted against time taken. The variables investigated were concentration of H202, and also the volume of the H202 and mass of Mn02 were varied in order to establish which values would be best for the main experiment.
The experiment was performed inside a side-arm boiling tube with a bung on top. The side arm led to a glass pipette, which was inverted in 50cm3 of water. The catalyst was added to the H202 and then the bung was place on top of the boiling tube, and the stop-clock started. There are several defects with the method. Firstly, it is quite difficult to obtain an initial rate as that would require multiple readings taken for various volumes given off which is reasonably accurate as it is based on human judgement – human error is very possible. Also, there was a limited range due to the size of the collecting pipette, which meant that up to only a certain concentration, volume and mass of catalyst could be used before it was too vigorous for the apparatus.
For this reason, a second method was devised, which worked by measuring the mass of oxygen given off on a top-pan balance. This is far more accurate equipment with far less scope for error, which makes the overall experiment more reliable. Other alterations were made in order to increase the accuracy of the experiment (mentioned later).
Controlled Variables
In order for the experiment to be a fair test, the variables that were not being varied should be controlled so that they cannot affect the experiment – otherwise it is impossible to tell what it is that is causing the change in results. Suitable values for these variables were needed that the results obtained could be plotted on a graph.
Temperature: This will be kept at room temperature (approximately 20 º) where possible, though it is difficult to keep this always constant as the reaction is exothermic, so heat will be given off during the experiment, especially as higher concentrations are used when the reaction becomes more vigorous.
Mass of catalyst: This was started at 1g (using middle of the concentration range of H202 – 10 Vol.), but the reaction occurred far too quickly and so did not give enough spread for a graph to be plotted. Therefore, the same experiment was attempted with 0.5g, and the results were similar. When only 0.25g of catalyst was used, this gave a decent, slow spread of results and a noticeable variation between concentrations and so 0.25g was decided to be the mass of catalyst to be used in the final investigation.
Surface area of catalyst: The manganese dioxide came as a powder and it did not seem to be unsuitable so this remained the same.
Atmospheric pressure: The difference between atmospheric pressure at different times providing you are in the same place is negligible and so does not really affect the experiment, and it is economically impractical to try and vary the atmospheric pressure. This therefore was discounted and not really worried about.
Volume of H202: This was started at 5cm3, but the reaction occurred far too quickly (with the medium concentration of hydrogen peroxide – 10 Vol.) – i.e. the mass reached a constant value too quickly. The same was true when 10cm3 was used, and so 25cm3 was settled on as an appropriate value for volume of H202 to be used in the main investigation, as it gave a good spread of results and the constant mass was not reached too soon even with the higher concentrations used.
Range of Results
I have decided that the suitable range of results for the main investigation will be to take an increment of 2 Vol. from 4 Vol. to 20 Vol., leaving us with 9 points to be plotted on the graph. This is a suitable amount of points to determine whether there is a trend and enough to draw a good line of best fit.
I have decided that to obtain the best possible accuracy, a repeat result will be taken, and if the two agree, then they will be averaged to give the point to be plotted. If they do not agree, then a further result will be taken and the two that most correspond will be averaged.
The time that the experiment is performed for will b determined by the results – it will be continued until 3 exactly the same masses are given off, so that we know that rate of reaction will have stopped increasing then.
Preliminary Results
Method 1 (collecting volume of gas using upturned pipette)
(note all volumes and concentrations refer to H202)
Concentration: 8 VOL
Volume: 20cm3
Catalyst: 1g
Inference: either there is too much catalyst, too large volume or too high concentration as it took too little time to collect over 50cm3 of gas.
Concentration: 10 VOL
Volume: 10cm3
Catalyst: 1g
Inference: there is not enough volume as it reaches the maximum amount of gas too quickly, but there is too much catalyst
Concentration: 16 VOL
Volume: 10cm3
Catalyst: 1g
Inference: concentration increases the volume of gas collected, there is still too much catalyst being used and not enough volume of H202 (you can tell this because the rate of reaction is too low – it reaches terminal mass too early)
The method was then revised to be more accurate – the rate was now to be measured by using mass lost and not volume of gas as we wanted to determine which was the easiest to use as an output variable and which was more accurate (gave better results)
Concentration: 10 VOL
Volume: 5cm3
Catalyst: 1g
Inference: not enough volume, too much catalyst (you can tell this because the rate of reaction is too low – it reaches terminal mass too early)
Concentration: 10 VOL
Volume: 10cm3
Catalyst: 1g
Inference: not enough volume, too much catalyst (you can tell this because the rate of reaction is too low – it reaches terminal mass too early)
Concentration: 4 VOL
Volume: 10cm3
Catalyst: 1g
Inference: not enough volume, too much catalyst (you can tell this because the rate of reaction is too low – it reaches terminal mass too early)
Concentration: 10 VOL
Volume: 10cm3
Catalyst: 0.5g
Inference: catalyst amount more suitable but still needs to be lowered, not enough volume (you can tell this because the rate of reaction is too low – it reaches terminal mass too early)
Concentration: 10 VOL
Volume: 10cm3
Catalyst: 0.25g
Inference: catalyst amount is suitable as it now takes suitable time for variation, but more volume needed to further extend this and make more variation
Concentration: 10 VOL
Volume: 15cm3
Catalyst: 0.25g
Inference: results are better, still slightly more volume needed in order to give a greater range of result
Concentration: 4 VOL
Volume: 15cm3
Catalyst: 0.25g
Inference: same as above
Concentration: 18 VOL
Volume: 20cm3
Catalyst: 0.25g
Inference: for main investigation, 0.25g of catalyst and 25cm3 of H202 shall be used.
Main experiment apparatus list and reason for choosing these apparatus
- Top pan balance – this is used to measure the mass lost and the mass of the catalyst at the beginning, and was chosen because it is not too expensive but still is reasonably accurate (to 3 decimal places)
-
H202 in increments of 2 Vol. from 4 Vol. to 20 Vol. – chosen because gives a suitable range of results whilst keeping the experiment safe – not too much heat is given out
- Spatula – this is used to measure out the catalyst, prevents having to use the hands (a safety issue) and also allows smaller masses to be taken out at a time
- Manganese Dioxide – this was chosen as a suitable catalyst, and although the reaction can happen without this, it is too slow to be measurable
- Stop clock – this measures time elapsed, it is reasonably accurate though there is the threat always of human error, but is also quick and easy to use, and economical
- Paper “bucket” – this was used to contain the mass and to pour it into the hydrogen peroxide, it is easy to use and has negligible effect on the scales (though these should be tared anyway)
- 10 ml measuring cylinder – used to measure volumes, chosen because it is easy to use whilst maintaining a high level of accuracy
- 100 ml beaker – the reaction occurred in this beaker, it did not contain the reaction too much as to make it dangerous but was not so large that the catalyst would miss the liquid
Detailed Method
- Tare the top-pan balance with the paper “bucket” on top of it at the time
- Weigh out the 0.25g of catalyst, and leave it on the balance
-
Measure out 25cm3 of whichever concentration is needed of hydrogen peroxide using a measuring cylinder
- Place the beaker onto the top-pan balance next to the bucket full of catalyst
- Tare the top-pan balance, and add the catalyst to the hydrogen peroxide
- Start the stop-clock at the instant of contact (N.B. remember to replace the paper bucket onto the top-pan balance)
- Record the mass loss every 5 seconds by looking at the balance
- Take a check reading for each concentration
-
The mass loss will be plotted upon a graph against time, and the rate of reaction calculated by taking a tangent of the curve, and then taking the gradient of that tangent.
Gradient = Change in y
Change in x
Safety/Precautions
Hydrogen peroxide is quite highly corrosive and can blind if it contacts the eye, so wear goggles at all times. Also, try to avoid contact with the skin and do not pour it from heights as it could splash out. Work on clear desks with chairs tucked in so that people do not trip over.
Precautions to maintain precise results
In order to try and obtain precise results, make sure all equipment is thoroughly washed after each use, try to measure the volumes and masses using the same measuring cylinder and top-pan balance, and try to do the whole experiment in one day so that you are only using the same solutions, as they can vary when they are made up on different days. Repeat results are taken and averaged in order to maintain reliability, as it can be seen as reasonably reliable if the same result is obtained more than once.
Prediction for main experiment
I predict that there will be a directly proportional relationship between concentration of hydrogen peroxide and rate of reaction (mass lost)- i.e. as the concentration doubles, so should mass lost providing all other variables remain constant. This should happen because if concentration doubles, so does the amount of hydrogen peroxide particles. If there are double as many particles, there is double the chance of a collision between the hydrogen peroxide particles and the manganese dioxide (catalyst) particles - hence twice as many should occur. This should result in roughly double the rate of reaction. The relationship should be linear, and the line of best fit should go through the origin (0,0) as the hydrogen peroxide does not decompose when it is just sitting in a beaker with no catalyst.
Observations
These results were then plotted on graphs, and tangents were drawn to calculate initial rate of reaction using the gradient of each tangent – equation:
Gradient = Change in y
Change in x
Analysis
The graphs showing mass loss (g) against time (s) clearly show that as time goes on, there is more mass loss. This occurs because in more time, more collisions between H202 particles and Mn02 (catalyst) particles can occur, meaning more decomposition and more mass loss occurring. However, the relationship is a curve (which means it is not directly proportional), and the curve levels off at the end – this is because all of the H202 particles become used up.
These results were collected using the graphs drawn comparing time (s) against mass loss (g), by drawing a tangent and working out the gradient of the tangent. These results were then drawn on a graph and any trends were identified.
The graph clearly shows that as the concentration of the H202 increases, so does the rate of reaction. This can be identified by a trend on the graph – the line of best fit is a diagonal one going from left to right, which goes through the origin. This suggests that the relationship is directly proportional – i.e. as the concentration of H202 doubles, so would the rate of reaction (providing no other factors are varied).
If lines are drawn upwards from the results at two different points, where the 2nd concentration is double the 1st, then it can be seen that at these points, rate of reaction of the 2nd is roughly double that of the 1st. This proves that the results are fairly reliable and that the line of best fit does describe the relationship between the two well.
Results taken directly from the graph:
These results confirm that the relationship is directly proportional according to my graph and line of best fit, as 0.8 is double 0.4 and 0.0145 is roughly double 0.0070 – i.e. as concentration doubles, so does rate of reaction.
Conclusion
Up to this range, as concentration of H202 increases, so does the rate of reaction. This occurs because, when there is twice the concentration of H202, there are twice as many H202 particles. These H202 particles collide with the Mn02 particles in order to make the Hydrogen Peroxide decompose. When there are twice as many H202 particles, there is twice the probability of a collision between H202 particles and Mn02 (catalyst) particles, and therefore twice as many collisions should occur. This means that when the concentration doubles, twice as many collisions between the H202 and Mn02 particles occur and the rate of the reaction also doubles.
My Prediction: If there are double as many particles, there is double the chance of a collision between the hydrogen peroxide particles and the manganese dioxide (catalyst) particles - hence twice as many should occur. This should result in roughly double the rate of reaction. The relationship should be linear, and the line of best fit should go through the origin (0,0) as the hydrogen peroxide does not decompose when it is just sitting in a beaker with no catalyst.
My results support the prediction to some extent. The relationship is a linear relationship that goes through the origin, and direct proportionality between concentration and rate of reaction can be observed using the graph. However, the prediction can only be supported up to this range (the only way to know if the relationship would continue afterwards would be to actually do the experiment with an expanded range), and there are some anomalous points – these however will be accounted for in the evaluation.
Evaluation
My results clearly support my prediction, and seem reasonably reliable as most points lie near the line of best fit, and there was enough of a correlation to draw a straight line of best fit. However, there are clearly anomalous points, which disagree with the total trend. These can be accounted for. Firstly, a possible reason for the fact that the two lowest concentrations give lower rate of reactions could be because as the concentration increases, so does the extent to which the reaction is exothermic. When this heat is produced, it acts as a variable, and more is produced the more vigorous the reaction – i.e. the bigger the concentration. Temperature has a direct effect on rate of reaction. As the temperature of the hydrogen peroxide increases, so would the average energy possessed by each hydrogen peroxide particle, and a greater range between the highest energy and lowest energy of a hydrogen peroxide particle would also increase – some would be moving extremely quickly whilst others extremely slowly. Therefore, as temperature increased, more hydrogen peroxide particles would have the activation energy required for a reaction to occur, and so temperature increases, so does rate of reaction. This means that the extra heat for the higher concentrations could have effected the results and increased rate of reaction – hence the two lower concentrations have figures slightly lower than the line of best fit. Apart from these two anomalies, there is one further anomalous point that lies only a bit away from the line of best fit. This could have occurred due to human error or due to people walking around the laboratory – i.e. measuring the volume of the H202 or the mass of the catalyst incorrectly (see % error), or the results could have been affected by the fluctuations on the top-pan balance caused by the change in forces by people moving around the classroom. Also, some results may have been taken on different days, perhaps when the temperature was slightly different which has been proven to affect rate of reaction. Also the atmospheric pressure could have been different due to different weather conditions – this could explain why the figure for the 0.88 mol concentration is slightly higher than others. Other possible sources of error are:
- It was very difficult to clean the manganese dioxide from the conical flask and often some remained inside. This can be corrected by adding a small amount of very concentrated hydrogen peroxide and seeing if it reacted or no. If it did, the flask would be rewashed, if it did not, it would be rinsed with water and then used
- Improperly mixed hydrogen peroxide, wrong concentration used: this would mean that the concentration would be a larger/smaller value than expected, and this (as the experiment proved) would affect rate of reaction
- The hydrogen peroxide could have already partially decomposed, which would mean that some of the contents would just be water – hence there would be less collisions between hydrogen peroxide particles and manganese dioxide particles, and rate of reaction might decrease but when it is not supposed to be doing so
- Unclean equipment – if the equipment was not fully clean it would make some of the chemicals react before the experiment, and therefore there would be less mass loss due to some of the particles having already collided with eachother
- The timer may well have been started at the wrong time – human reactions mean that there is some scope for error in this, and this could have meant results were being recorded at the wrong times
- Percentage error – each piece of equipment used for measuring has a percentage error, and this gives some scope for distorted results. The percentage error was calculated for each measuring equipment piece and then the total percentage error calculated, and error bars were drawn onto the graph in order to determine which points were/were not anomalous.
Top pan balance measured to the nearest 0.01g, and the measurements taken were 1x0.25g and the actual experiment. For the first graph, the average value taken was 0.11g. For the second graph, the average total mass lost measured was 0.44g. This was done once per reading, so the experimental error for the top pan balance is:
-
(g) ÷ 0.25 (g) = 4.0% for each measurement of the mass of catalyst.
0.01 (g) ÷ 0.44 (g) = 2.3% for the graph
The measuring cylinder can be measured to the nearest 0.1ml, the measurements taken were 2x 10ml and 1x5ml. It was taken once per reading, so the experimental error for the measuring cylinder is:
- (ml) / 10 (ml) therefore there is 1% error per 10ml reading, 1% x 2 (there are 2 readings) = 2%
- (ml) / 5 (ml) therefore there is 2% error per 5ml reading
2% + 2% = 4% total percentage error for measuring cylinder
Therefore, total % error for the graph is 10.3%. If the graph is redrawn with error bars, the following is shown:
As the anomalies can be accounted for, and most points lie pretty near the best fit line, and when readings were taken from the graph and tested for proportionality they confirmed the prediction, my results are sufficient to justify the prediction for this range. The results are reliable because repeats were taken to make sure they were not flukes, and because they all lie reasonably close to the best fit line – and anomalies have a clear reason for their presence. However, in order to 100% justify the prediction, the experiment would have to be repeated with certain improvements.
Improvements to the experiment if it were to be redone:
- Investigate a larger range of concentrations (this can be used to determine whether there really is a terminal rate of reaction/mass loss)
- Use more accurate top-pan balance, and use a burette to more accurately measure volume
- Conduct the experiment in a vacuum where there is no atmospheric pressure, and contain the temperature using a temperature probe, taking a reading to make sure the temperature never alters. There will also be no people moving around the top pan balances which causes fluctuation and uncertainty over reliability of readings
- Further investigate rate of reaction using a different variable
- Extend this experiment by using an alternate method – see below
- Do the experiment was using a gas syringe to collect the oxygen gas in, so that the volume given off could be plotted against the time taken for that volume to be collected. Do the experiment in a boiling tube with a rubber bung on top, through which there can be some tubing. This led to the gas syringe, which can measure how much gas has been collected. The rate of reaction could then be calculated by drawing curves for each concentration, and then dividing volume collected by the time it took to collect.