Plan
There are some possible factors that can be varied for the preliminary experiment:
-
The height of the runway- the larger the height of the runway, the more the gravitational pull on the trolley. This means the trolley will move with a greater speed at a higher gradient than at a lower one.
-
Length of the runway- the longer the runway, the more will be the acceleration of the trolley as it will have a greater time to travel on a slope before reaching the flat ramp when it will travel at a constant velocity in a straight line except when air resistance and friction become effective.
-
The surface of the runway and the ramp- the rougher the surface, the greater the contact area between the trolley and the runway, thus more will be the force of friction and thus slower will be the velocity of the trolley when compared to the travel on a smooth surface.
-
The angle of the runway/ gradient of the slope- the more is the angle of the run way i.e. the higher the trolley is placed, the more gravitational potential energy it would have and thus more acceleration it will have as it comes down the ramp.
-
The mass/weight of the trolley- If the trolley has a greater mass, it will have more gravitational potential energy on the runway and there will be a stronger gravitational pull upon it, which will lead to more kinetic energy when the trolley is travelling down the runway and so it will have a greater velocity.
-
The contact area between the trolley and runway as well as the trolley and ramp- the larger the contact area, the greater the amount of friction, which will lead to the trolley moving slower.
-
Air resistance - the faster the trolley is moving, the greater the amount of air resistance, so the quicker it will slow down on the flat surface.
The Variable factors:
The velocity of the moving trolley is affected by the following factors:
- Mass of the trolley
- Area of contact surface
- Gradient of the slope from which the trolley will start its motion
- Friction between the surfaces of contact
- Air resistance
There are two ways in which the experiment will be measured:
- Meter ruler
- Ticker timer and Ticker tape
SAFETY PRECAUTIONS AND PROCEDURES
- Care will be taken with the power supply, as electricity is being used.
- Two or more people will lift the runway and it is very heavy and may cause injury if it is not lifted careful and well supported.
- There will always be one person at the end of the flat runway so as to catch the freewheeling trolley.
- The trolley will be handled with care as it may cause damage if not kept in safe place in-between experiments.
- All group members will be alert during each experiment, this is so that no one is injured and not damage is caused to property.
- At each height interval a few test runs will be done so that the apparatus can be aligned to avoid any accidents.
Preliminary Experiment:
In the preliminary experiment three factors were varied in order to decide the most suitable one to investigate as a variable for the final investigation.
-
The height of the runway. Two heights were investigated, a high one at 50 cm and a low one at 20cm.
-
The mass of the trolley. The trolley has a mass of 1kg; therefore this was tested and noted as the lighter mass reading. For the heavier mass reading, I decided to double the mass of the trolley by adding ten 100-gram masses, which were cellotaped to the trolley. This was decided as I felt that double the mass should lead to double the speed, which would give a good idea of the effect of mass on the trolley, if this were chosen as the final variable.
-
The surface of the runway and flat ramp. This was varied using the bare wood of the runway and ramp as the smooth surface and kitchen roll as the rough surface. The kitchen roll has a larger contact area than the bare wood, which is more likely to affect the speed of the trolley.
To ensure that the preliminary and the final investigation were accurate and fair the same runway, ramp, trolley and ticker timer (number 4) were used.
Apparatus:
Power pack Ticker tape
Two leads Ticker timer
Runway Cellotape
Ramp (1m) 10 X 100g masses
Trolley Kitchen roll
Retort stand (X 2) Metre ruler
Two clamps Bar
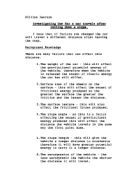
Diagram:
Method:
The apparatus was set up as shown in the diagram above, for all three following experiments.
GRADIENT OF RUNWAY
- The runway was lifted to 20cm high using a metre ruler to measure the height from the bench to the top part of the retort stand bar.
- The ticker timer and tape was set up, before the tape was cellotaped to the back of the trolley.
- The trolley was placed at the top of the runway and released when the ticker timer was started.
- The ticker timer was stopped when the trolley was stopped at the end of the flat ramp.
- The tape was removed and measured from the start of the regular interval dots; this was placed at the beginning of the flat ramp and marked off one metre down the flat ramp.
- The number of dots in that marked off section was counted and the number recorded. This would then be used to calculate the speed.
- The trolley was then raised to 50cm in the same way as before.
- The experiment was then repeated at 50cm height and the results recorded as before.
The results of this investigation are displayed below.
After looking at the results I decided to keep the runway at 50 cm as this gave a better speed-readings. I felt this height would be preferable for my final experiment as a small error in higher readings is less likely to show effect and than those with low readings. It would also allow me to chart the graph better with high readings.
MASS OF THE TROLLEY
- The trolley by itself has a mass of 1kg so this was tested first as the lighter reading.
- The ticker timer and tape were set up as in the previous investigation.
- The trolley was released at the top of the ramp and stopped when it had passed 1 metre on the flat ramp.
- The tape was measured as before and the number of dots recorded as in the first section of the experiment.
- Ten 100g masses were cellotaped in pairs to the top of the trolley.
- The experiment was repeated with 2 kg mass of the trolley.
I decided to keep the mass at 1kg as I found this to be better than sticking the added masses to the trolley, which did not stay in one, place and were likely to give inaccurate results.
Multiple added masses made the trolley uneven and unstable.
SURFACE OF THE RUNWAY AND RAMP
- The trolley was run on the bare wood of the runway and the ramp as the smooth surface.
- The ticker timer and tape was set up as in the previous section of the experiment.
- The trolley was released and stopped in the same way as in previous experiments.
- To test the trolley on a rough surface the runway and the ramp were covered with kitchen roll, which was cellotaped down so that it did not move during the experiment.
- The experiment was repeated.
I felt that the bare wood gave a good reading as there was a smaller contact area between the trolley and runway and the ramp, so the friction is minimal. In addition I found that despite all the care, the kitchen roll was adding friction unequally as it was tending to fold in places.
After studying all my results from the preliminary, I have decided to keep the following factors constant:
- The mass of the trolley at 1kg, which is its original mass. This is because it will avoid any possible errors, for example if one of the masses were to fall off during on of the runway.
- The surface of the runway and ramp will remain as bare wood. This is to ensure that the experiment is not obstructed, which may happen if the kitchen roll was used as it may collect at one or more spots giving an uneven surface of contact with the trolley or it may tear as the trolley came down the ramp. This is likely to affect the accuracy of the results.
I have decided to keep the gradient of the slope as my variable factor to study in the final experiment. This was decided because it would provide me with a larger number of readings, easy to replicate and easy to set up without being affected by factors that I feel would affect the other two variables. A large number of readings will reduce the errors to the minimum and allow me to get a more accurate analysis of my results.
Improvements in my final experiment:
Δ The trolley will be started 150cm from the bottom of the runway, in order to make the movement of the trolley more accurate.
Δ The trolley will be released and the power pack started at the same time by myself, this is to avoid the delay in reaction time between pupils.
Prediction: I predict that as the height of the ramp is increased, the speed of the free wheeling trolley will increase. However, the increase will not be a linear one as some energy will be lost through friction in the form of sound and heat.
FINAL INVESTIGATION
Apparatus:
Power pack Ticker tape
Two leads Ticker timer
Runway Cellotape
Ramp (1m) Metre ruler
Trolley Bar
Retort stand (X 2)
Two clamps
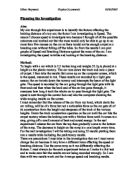
Diagram:
Plan:
- The apparatus will be set up as shown in the above diagram.
- The gradient of the runway will be varied at 10cm intervals from 10cm to 60cm.So the top of the bar held by the two retort stands will be measure to 10cm, 20cm, 30cm, 40cm, 50cm and 60cm using the metre ruler from the bench surface upwards.
- The meter ruler will then be used to measure 150 cm from the bottom of the runway up, and that level will be marked on the runway.
- The meter ruler will be used to measure 1 meter of the ramp, which will also be marked on the ramp.
- The ticker tape and timer will be set up, and then the tape attached to the end of the trolley.
- The back of the trolley will be in line with the 150cm mark on the runway.
- The trolley will be released and the power pack started at the same time.
- The power pack will be switched off exactly when the trolley has passed the end of the ramp, where a fellow pupil will stop it.
- The tape will be removed and measured and marked from the start of the regular interval dots; form that mark it will be placed at the beginning of the flat ramp and marked off one metre down the flat ramp.
- The number of dots in that section will be counted and the number noted. This will then be used to calculate the speed.
- The experiment will then be repeated in the same way for the other readings.
- The whole experiment will then be repeated in order to obtain an average.
In the final experiment two of the gradient heights were changed, the first gradient was changed form 10cm to 15cm, as the trolley did not move sufficiently enough so that a reading could be obtained. The second reading that was changed from the gradient at 50cm to 45cm. This was because it would have been too dangerous to free wheel the trolley down as it would move to fast and may have caused injury.
The results of the two readings are shown below:
The number of dots for the two readings were added together and then divided by two in order to obtain an average number of dots, this was then used to work out the average speed for each gradient as shown below.
The above results were plotted on to a graph with height of the runway along the X-axis and the average speed of the trolley along the Y-axis. On the same graph paper a curve was charted using theoretical results obtained using my background knowledge. The aim of these was to compare the results that one would expect from such an experiment and the results actually obtained by me during the real experiment.
ANALYSIS
In order to analyse my results, I used the equation mgh=1/2 mv2, as the equation for my theoretical results. This would allow me to compare my results to the one expected.
I know that the Gravitational potential energy in the trolley was converted into kinetic energy when the trolley started to role down the ramp.
The gravitational potential energy = mgh (mass x gravitational field strength x height)
Mass of object in Kilogram (kg). This is 1kg and a constant for my study
Gravitational field strength is 10meters/second a constant in my study
Height of the ramp in meters is the variable in my study
Kinetic Energy = ½ mv2
The mass m is measured in Kg
The velocity V of the vehicle is measured in m/s
Assuming that all the Gravitational Potential energy in my experiment is converted into Kinetic energy, then one could say:
mgh= ½ mv2
gh=1/2 v2
I used this equation to create a graph using my results. The calculations are shown below.
My results show that the trolley in my experiment attained a lower speed on the ramp as compared to theoretical results for the same height. This I feel is because the air resistance and friction affected my results. The theoretical results were calculated assuming that there was no air resistance or friction.
The line of best fit on my graph followed the general pattern of the curve of the theoretical results. This indicates that my experiment was done correctly and that the results were close to what was expected. As in the theoretical graph, my results showed that as the height of the ramp was raised, the speed of the trolley increased as well. As expected this relationship was not a linear one in both the theoretical graph line and my comparative graph line.
The theoretical results show a gradual and smooth increase in the speed of the trolley as the height of the ramp is increased, but my results have shown some deviation from the line of best fit.
From the graph it is clear that greatest speed of my trolley, if it had followed the exact pattern of the theoretical results, would have been 3.0 m/s. However in the real experiment, due to friction between the wheels of the trolley and the surface of the runway and the air resistance, my trolley could only pick up a maximum speed of 2.0 m/s. Air resistance is an opposing force, which I believe would have been higher at high heights. These two factors were not taken into account when the theoretical results were obtained. In addition my result would also have been affected by the gravitational pull on the trolley.
Some of the results in my graph, the one at 0.15m, 0.30m and 0.45m were deviated from the line of best fit. I feel these anomalies are due to friction, air resistance and possibly due to irregular surface of the runway, which may not have allowed the trolley to go down smoothly and in a straight line. This would show why my experimental results were not exactly the same as seen in the theoretical graph, in which these factors were ignored.
It was interesting to note that the speed of the trolley in my experiment at 0.30m height and 0.45m height of the ramp was exactly the same. This would indicate that either the readings calculated were not accurate or the height of the ramp was not the same on both sides.
Although it is a fairly crude experiment with so many different possible anomalies, it has proven what I set out to study that the increase in the height of a ramp will increase the speed of a free wheeling trolley.
Conclusions:
After analysing my results I can conclude that my experiment has shown that the speed of the trolley increases as the height of the ramp is increased, however not in direct proportion as expected. The smooth curve of the theoretical results ignores the factors like friction, air resistance and the irregular and uneven surface of the runway.
The results of my experiment support my prediction that the speed of a freewheeling trolley increases as the height of the ram is increased and the increase is not linear.
EVALUATION
Analysis of my results shows my procedure to be fairly accurate as it follows the general pattern seen in the theoretical results used. However as the results plotted on the graph in my experiment has shown certain readings outside the line of best fit indicating errors in my recorded results.
I can identify three anomalies from my graph. The three readings of speed of the trolley when started at 0.15m, 0.30m and 0.45m height of the ramp are below the line of best fit, although not very far. The reading at 0.15m height of the ramp has shown the maximum deviation from the line of best fit.
My three anomalies could have been caused by:
- The trolley being not started and or stopped at exactly at the same point.
- Delay in starting the ticker timer as compared to leaving the trolley to role down.
- The run way surface may have been uneven due to wear and tear.
- The height of the runway may not have been exactly the same on both sides.
- The trolley may not have been released freely every time.
- Inaccuracy in counting the dots on the ticker-timer.
I feel my procedure was suitable for this experiment as the results of my experiment are following very closely the pattern and structure seen in the theoretical results. To avoid the few anomalies I have encountered in my results, I could have tried the following:
- Taken multiple (more than 2 that I have taken) readings and then used the average of the results to chart my graph.
- I should have started the ticker timer and released the trolley myself so as to time them accurately.
3. I should have clearly marked the trolley starting and stopping point so as to ensure that the distance being covered was the same each time.
- I should have secured the ramp and the runway together.
5. I should have cleaned the wheels of the trolley to make sure that was nothing stuck to them, which could increase the friction or make the run uneven.
6. Instead of using the ticker timer to measure the speed, I could use a light gate, which will give more accuracy to my results by avoiding the human error in counting the dots on the ticker tape.
The evidence does support my conclusion and prediction that the speed of the trolley increased when the height of the runway was increased, however they were not in a linear relationship.
My experiment has clearly shown that the speed of the free wheeling trolley increases as the height of the ramp is increased. Even though the results obtained were not completely accurate, the overall pattern of the graph obtained from my results did follow the pattern of the theoretical graph. When the factors like friction, air resistance and the gravitational force acting on the trolley are taken into account one can easily explain the difference between the theoretical results and my experiment.
As a further experiment, I could see how other factors like surface of the runway; type of trolley, mass of trolley and contact area would affect the speed of the trolley when one factor is made variable for one set of experiment.
To see if friction between the runway and the wheels of the trolley make any difference, I could use carpet lined runway for high resistance due to more unrefined fibres and a perpex or glass runway for low resistance due to its smoother surface. The rougher surface will provide more friction and thus allow me to see the extant to which it will slow down the trolley.
To see the effect of mass I can use a large and a small trolley of different mass, instead of adding mass into the trolley, and see how it affects the speed as to whether the speed is increased by a greater mass as compared to a smaller mass.
To see the effect of the contact area, I could use a trolley with less number of wheels (small contact area) and one with large number of wheels (large contact area). The smaller contact area means that the friction between the wheel of the trolley and the runway would be less.
These further experiments will show which other factors that affect the speed of a trolley when released from a height.
BIBLIOGRAPHY
- Google.co.uk- Physics Factors affecting the speed of a trolley on a ramp
- Letts A-level guide to Physics (2000)
- Ask Jeeves.com Factors affecting the speed of trolley on a ramp (2003)
4. New Book of knowledge (1998).