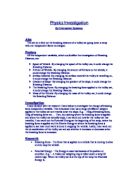
Method
First we will set up our apparatus as shown in the diagram then we will choose a distance between each of the light gates so we know that the distance between the light gate’s haven’t changed. Then we will get a block of wood and stick a weight to the block of wood using blue-tack. After we have stuck the weight to the block of wood we will weigh the block of wood on the scale and record the weight. We will then let the block of wood slide down the ramp then the computer will have then calculated the velocity of the block of wood going down the ramp. We will do the same experiment five times so we can get a more accurate result and work out the average velocity of the block of wood with one weight.
We will then put two weights on the block and stick the weights to the block with blue-tack. After we have stuck the weight to the block of wood we will weigh the block of wood on the scale and record the weight. We will then let the block of wood slide down the ramp then the computer will have then calculated the velocity of the block of wood going down the ramp. We will do the same experiment five times so we can get a more accurate result and work out the average velocity of the block of wood with two weights.
We will then put three weights on the block and stick the weights to the block with blue-tack. After we have stuck the weight to the block of wood we will weigh the block of wood on the scale and record the weight. We will then let the block of wood slide down the ramp then the computer will then have calculated the velocity of the block of wood going down the ramp. We will do the same experiment five times so we can get a more accurate result and work out the average velocity of the block of wood with three weights.
We will then put four weights on the block and stick the weights to the block with blue-tack. After we have stuck the weight to the block of wood we will weigh the block of wood on the scale and record the weight. We will then let the block of wood slide down the ramp then the computer will then have calculated the velocity of the block of wood going down the ramp. We will do the same experiment five times so we can get a more accurate result and work out the average velocity of the block of wood with four weights.
We will then put five weights on the block and stick the weights to the block with blue-tack. After we have stuck the weight to the block of wood we will weigh the block of wood on the scale and record the weight. We will then let the block of wood slide down the ramp then the computer will then have calculated the velocity of the block of wood going down the ramp. We will do the same experiment five times so we can get a more accurate result and work out the average velocity of the block of wood with five weights.
We will calculate the average for one of the experiments by adding up the five results and dividing them by 5 to get the average total, we will do this for the rest of the other four experiments.
OBTAINING EVIDENSE
ANALYSIS
Graph
Conclusion
In my investigation on the velocity of an object with various weights added to it I discovered that adding weights to the wooden block doesn’t have a big impact on an objects velocity. I discovered this by looking at the best line of fit on the graph, which is the line from the first result to the last result.
I also discovered that friction can have a big effect on an objects velocity if it is present.
Patterns in the Graph
I discovered in the graph there is a weird pattern because: -
The velocity of the block going down the ramp with one weight is 81 cm/s,
Then it decreases to 75 cm/s as it goes down the ramp with two weights,
Then it increases to 79 cm/s as it goes down the ramp with three weights,
Then decreases again to 77 cm/s as it goes down the ramp with four weights,
Then it increases again to 80 cm/s as it goes down the ramp with five weights.
I think the reason for these odd results is because of the weights scraping against the side of the ramp, which was causing friction upon the block of wood.
I also discovered if you draw a line from the block of wood with one weight to the block of wood with five weights there is only a 1 cm/s decrease in velocity between them both.
The line drawn from the first result to the last result is called “The best line of fit.”
EVALUATION
I think my method is good and accurate so that if someone else who had not done the experiment could follow my method and not get confused or stuck.
I think my results are accurate because I did the each experiment five times and worked out the average for a more accurate result.
I think that my results are accurate towards the five experiments I did for each one but the results I got look odd when they are displayed on the graph. I think this is because of friction occurring between the ramp and block of wood when it is going down the ramp.
My results are not very reliable because they look odd but if I were to do the investigation again I would do each experiment 10 times so that I get more accurate results to when I come to work out the average result and I would also use a wider ramp so friction cannot take place.
I think the reason for getting odd results is due to the friction of the block of wood rubbing against the side of the ramp.
The results I have are sufficient enough to come to a conclusion because of
“The best line of fit” that is drawn from the first result to the last result, from this information I can reach a conclusion.
Additional Experiment
To extend my investigation in this subject I could of looked at the velocity of the wooden block with deliberate friction added to the block of wood to see how much friction can reduce the velocity of the wooden block by comparing the results with the results I have now.
If this experiment was carried out I would have used sand paper that would of been stuck to the bottom of the block of wood to cause the deliberate friction between the wooden block and the ramp.
This experiment would have been good to see how friction effects our lives by looking at the good points of friction and the bad points of friction such as: -
- Friction between the rubber tyre and road to help the car stay on the road and not slide of so we are safe from any danger.
- Friction between the body of the car and the air resistance which causes the car to loose acceleration.
- Friction in a cars piston engine which causes: -
- Gears and cogs to ware out
- The engine to be lubricated at various times this costs money and time