Increase in height of ramp=increase in velocity of trolley
Equations/Units/Ranges to be used
Range:
To make this investigation successful, a sensible range must be chosen and also the amount of readings to record in order to come up with a useful and informative outcome. For example, in the experiment it would be pointless to experiment with heights ranging from 1cm-2cm because the speed difference would be minor. Instead a more sensible range, such as from 10.0 cm-25.0 cm, would be appropriate to yield useful results. The readings should be taken at 2-5 cm intervals, and a minimum of three readings should be taken on each height to work out an average (this makes the end result more accurate).
Below is a clear list of the ranges and amounts in my two experiments.
Experiment-three tests on each height, starting from 11.0 cm
13.0 cm
15.0 cm
17.0 cm
19.0 cm
21.0 cm
23.0 cm
25.0 cm
Equations:
PEgrav = mass * g * height
where g = gravitational constant (9.8 m/s)
KE = ½ * m * v²
where m = mass of object (Kg)
v = speed of object (m/s)
The formula that will be proved in the experiment is EK = EP.
PEgrav = KE
mass * g * height = ½ * m * v²
g * height = ½ * v²
9.8 * height = ½ * v²
Units:
-
Metres (metre ruler to measure height)
-
m/s [for velocity, as it is the displacement of an object over time (secs)]
-
Kg ( unit for mass of the ball) **not required**
-
9.8 m/s (gravitational constant)
Variables:
It is important to control all other variables except the height of the ramp during the practical, to ensure fair and accurate results. The final velocity of the ball is a dependent variable, as it is expected to change according to the height from which the ball is released. Finally, the mass of the ball does not need to be altered, as it does not relate to the result of the experiment as shown below.
Dependent Variable:
-
Velocity- The final velocity of the ball depends on the height at which the ball is released each time.
Independent Variable:
-
Height of ramp - as this is included in the formula for potential energy, the height of the ramp will affect the speed of the trolley. I will be modulating this variable in the experiment, and therefore, it is a independent variable.
Controlled Variables:
-
Mass and type of ball - mass is also included in the formula for potential energy and so could affect the speed of the trolley one way or the other. With this experiment, the mass and the type of ball used will be kept constant as it is not required to be manipulated as shown below.
-
Gravity - the last portion of the formula for potential energy is gravity, which will affect the outcome if it is increased or decreased. Since the experiment is being performed on earth, the gravitational constant (9.8 m/s) remains the same throughout the experiment.
-
Friction- Friction is one of the factors may use some of the energy when it is being converted into kinetic (movement) energy as the ball moves down the ramp. The friction between the ball and the surface of the ramp can use up some of the potential energy used to move the ball and convert it to heat instead. This can slow down the trolley, but only very slightly. To maintain the same friction for all the results we should use the same material for the surface of the ramp, and the same type of ball throughout the experiment. No grease should be added to lubricate any equipment.
-
Size of the ramp- The size of the ramp should be kept constant to prevent any differences in the results.
-
Positioning of the laser beam to measure the final velocity- The position of the laser beam has to remain the same throughout the practical, to ensure the results found are fair and accurate. Also, the position of the laser beam should be right at the bottom of the ramp to find out exactly, how the change in height affects the velocity of the ball.
Safety Issues
With this straightforward experiment there is not much that needs to be taken into consideration. No harmful substances are being used, neither are flames or solvents, hence, there are no safety concerns. All-in-all it is a relatively safe experiment. Obviously the need to take precautions when releasing the ball at different heights is necessary, as well as refraining from watching the ball too closely, as it may hit the eyes or face.
Also, at the bottom of the ramp some sort of barrier will need to be placed to prevent damage to the ball as it hurtles off the edge, or to thwart potential harm to any unsuspecting person.
Materials/Apparatus:
- 1 cardboard box (A4 size)
- 1 ramp (metal or wooden)
- masking tape
- 2 cardboard sheets (thin)
- laptop
- laser equipment
- 1 wooden block ( acts as a stopper for ball)
- metre ruler
- 2 wooden blocks
- blue tag
- ball (30mm)
- capacitor (50v)
- power supply
- Calculator
Reasons for choosing apparatus:
- 1 cardboard box (A4 size): For one side of the ramp to rest on, to increase the height of the ramp summit
- 1 ramp (metal or wooden): For the ball to roll down
- ball (30mm): To roll down the ramp
- Masking tape: To keep the cardboard sheets on the ramp securely stuck to the bench.
- 2 cardboard sheets (thin): To keep the level of the ramp, same to the bench, allowing the ball to roll down smoothly.
- Laptop: Used for the program required to measure the velocity of the ball as it passes the laser beam.
- Laser equipment: To effectively and accurately measure the final velocity of the ball as it passes through, at the bottom of the ramp.
- 1 wooden block ( acts as a stopper for ball) : To stop the ball from flying off the bench
- Metre ruler: To measure out the different heights on the ramp.
- 2 wooden blocks: To keep the laser beam at a suitable height, so that it hit the ball right in the middle, as it rolled through.
- Blue tag: To firmly stick the laser equipment on the wooden blocks.
- Capacitor (50v): To provide charge for the laser equipment to run.
- Power supply: Used to provide charge for the laser equipment.
- Pencil - To mark the start (different heights) and finish lines.
- Data Collection Sheet - To record the results on
- Stationary - To write the results down with
- Calculator – To calculate average velocity
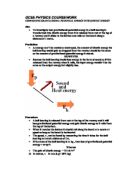
Below is a diagram of how the equipment will be set up and used.
Method:
- Collect all materials
- Set out equipment as shown in the diagram above
- Measure the diameter of the ball with the metre ruler.
- Place an A4 size box on the table/bench
- Put the ramp on the box
- Stick the cardboard sheets onto the ramp, to make the ramp level to the table
- Connect the laser equipment to the laptop and power supply
- Ensure that the laser beam goes through the middle of the ball being used.
- Begin marking different heights on the ramp.
- Ensure the height at the start line (the summit of the ramp) is 10.0- 15.0 cm using the metre stick
- Hold the ball with its front touching the start line
- Simultaneously start the velocity measuring program and then, release the ball (be careful not to push it or exert any extra force on it)
- Ensure that the ball has travelled in a more or less straight line, to increase accuracy in the results.
- Record the time taken for the ball to reach the finish(wooden barrier), next to the relevant height, in a table
- Repeat Step 4 twice more so you end up with three results for the same height then continue onto step 9
- Add all these results together and divide the answer by three to obtain the average.
- Record this average in the table as well.
- Using the metre ruler, measure another height, around 1.0-5.0 cm higher then the one used previously.
- Repeat Step 4 until you have obtained results for at least another six to seven heights.
- For each different height, repeat Step 4 twice to get at the average of three results.
-
Record all the results on the table.
How variables were kept constant:
The variables were kept constant by ensuring that they were controlled. The most important variables that was to be controlled was the positioning of the laser equipment and the mass/type of ball used on each try.
Difficulties encountered and how they were overcome:
- Accuracy of measurements: used a metre ruler to measure
- Making sure the ball travelled in a straight line: Tried to release the ball as straight as possible and repeated the trial if the final velocity seemed to be to big or small as compared to the others
- Ensuring that the laser beam went through the middle of the ball: put the laser equipment atop a wooden block, to keep level with ball
- Accuracy of final velocity: conducted three trials for each height
Results:
The results obtained were as accurate as possible, and covered a range of heights from 11.0 centimetres to 25.0 centimetres and not above that, as the length of the ramp did not allow so. Also, the results obtained were narrowed to ± each side of the result. Lastly, the results from three different trials for each height were obtained and then averaged to ensure accuracy.
* All results to 4 decimal places
Graphs: on next page
Analysis of results:
The data collected relates to the aim, as the results show what the final velocity of the ball, at the bottom of the ramp is, for the different heights from which the ball was released. The results obtained were able to be used, to prove the relationship between gravitational potential energy and kinetic energy.
The graph, of the average velocity versus the height of the ramp clearly shows an increase in speed as the height of the ramp greatens, but not in a proportional manner. The slight curve suggests that another force such as friction or air resistance might be acting on the ball and not permitting it to increase speed uniformly.The friction of the ramp or some air resistance may have caused the ball to go faster or slower.
Nevertheless, the results cearly show that the higher the ramp the faster the speed of th abll. This can be explained. The higher an object goes the more gravitational potential energy it gains. When the ball rolls down its potential energy is converted into kinetic energy and since energy can neither be destroyed or created, and only converted; it will move at a faster speed. So therefore height does affect the speed at which an obejct travels down a ramp.
In the second graph, √ Velocity versus height, a straight line was obtained, showing that there was a relationship between the height of the ramp and the √ velocity. This can be seen by the following working out:
Calculations:
First of all I am going to calculate the average potential energy at each height.
Potential energy = gh (mass not required)
Then, the average kinetic energy at each height.
Kinetic energy = 0.5 x (velocity)² (mass not required)
(tanle on next page)
Graph of Potential and Kinetic Energy
The graph above, on overall shows that as the height increases the potential and kinetic energy increases. The higher the object is the more energy it gains as you can see on the above graph where it displays potential and kinetic energy. Hence, the higher the height from which the ball is released, the more the potential energy converted into kinetic energy, resulting in the incresing velocity.
Higher the object = more energy gained
Potential Energy = Kinetic energy
From the above analysis, it is evident that as the height from which an object is increased, the potential energy stored in an object increases as well. This energy is converted into kinetic energy, which results in the increasing velocities of the ball. However, in the above investigation, potential energy ≠ kinetic energy. This is probably because some of the energy was lost to friction as heat energy. Also, some errors in the calculation of the heights may have resulted in the inequality between the gravitational potential energy and kinetic energy of the ball.
Evaluations:
The experiment went very well and ran efficiently, thanks to the plan we had drawn out beforehand. The laser equipment helped to make sure that our results were accurate and could be counted on. For our experiment, we didn’t require it to be as accurate as the computer system allowed so we rounded the results off to four significant figures.
The results found helped us to prove that if the same object is used in all trials, then the mass variable can be removed from the equation of kinetic energy and potential energy. Also, the results found proved our hypothesis, that as we increased the height from which an object is released, its velocity will increase as well, as a result of the gravitational potential energy stored in the object before release is converted into kinetic energy in the form of its velocity.
In terms of the accuracy of our results, there were some errors and inequalities which may have resulted because of several reasons such as errors in measuring the heights, energy loss due to friction and maybe the ball not traveling in a straight line.
If I were to do this experiment again, I would experiment with different surfaces of ramp. Also I would try to use a trolley instead, that travelled in a straight line! The main problem we found in our experiment was that the ball kept swaying to the sides, as the heights increased, creating a longer journey and resulting in the slightly inaccurate results. This could have been due to an uneven surface on the ramp, or because the ball was not released in a straight line.
Nevertheless, the investigation proved the point we were trying to find out, which was that the potential energy stored in an object increases as the height from which it is released increases, and this in turn increases its final velocity.
Inferences:
Limitations of apparatus and measuring equipment:
- Ball not rolling down the ramp in a straight line
- The metre ruler, had to be put vertically to measure the height, and may not have been accurate.
- Uneven surface of cardboard sheets resulted in friction, causing the ball to lose some energy as it rolled down
- Ball was too light, and therefore swayed to the sides as it rolled down.
Uncertainty of data and calculations:
- Making precise points, for the different heights, due to parallax error.
- Estimation of where to draw point for each height, resulting in a ±0.5 cm inequality
- Some of the results were not very accurate resulting in some inaccuracies.
Expected and derived relationships or physical values:
- The expected result for the relationship of the height from which the ball was released and its velocity was that as the height increased the velocity of the ball would increases as well. This is also due to the fact that as the height increases, the potential energy stored in the ball increases, and so consequentially so does the kinetic energy and therefore the velocity of the object increases as well. The derived results are quite accurate, due to the result being obtained and averaged out by obtaining results of three other trials. However, the results can be further improved by using a frictionless surface for the ramp and also using a trolley to ensure it travels in more or less a straight line. This would make it easier to obtain accurate results and find a more accurate relationship between the potential energy of an object at different heights and its kinetic energy.
Conclusion:
The investigation of the relationship between the height of the ramp and the final velocity of the ball was more or less a success. The relationship between potential and kinetic energy was more or less found and proved, despite some inequalities in the results. Also, the gradient, the graph, for kinetic and potential energy was a constant, showing that the total kinetic energy of an object is proportional to its potential energy.
Word Count: 2489 words
Done By:
Jitendra Jain
Year 11 A