The hydrochloric will stay at a constant amount of 5 ml because it needs to react with the solution.
The amount of thiosulphate decreases in volume as the water increases , so that the concentration of the solution varies from high to low.
Main experiment
Aim: to see what happens to the rate of reaction when the concentration of sodium thiosulphate changes.
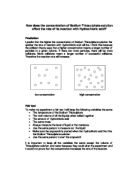
Diagram
Apparatus
1 x stop clock
3x measuring cylinder( 10ml,50ml and 100ml)
5 x beaker
5 x different solution( each containing hydrochloric acid, water and thiosulphate)
Paper with a red cross on
Safety
1. As soon as the solution is made, it must be tipped down the sink, to reduce sulphur dioxide gas.
2. Also open all windows to reduce the amount of sulphur dioxide gas
Method
Measure out the correct amount of thiosulphate(use different sized measuring cylinders depending on amount needed I.e. if you need 8 ml you use a 10ml to measure it out-this is done so it is more accurate) using a measuring cylinder then add the correct amount of water to the thiosulphate as they do not react unless hydrochloric acid is present, and tip into a beaker above the paper with the cross on. Using the correct measuring cylinder and measure the hydrochloric acid then add both to the thiosulphate. Press the stop clock and time the amount of time it takes for the solution to go from clear to milky and how long it takes for the cross to disappear. Then record your results in a table and transfer to a suitable graph. The mixture will turn milky because of the reaction, but the time it takes to do this will vary depending on the strength of the concentration.
Fair test
To ensure that the experiment is fair a few simple things must be done.
Firstly the same volume of hydrochloric acid must be used in all of the experiments. The hydrochloric acid must also have the same concentration throughout the experiment other wise it makes it unfair.
The same volume of thiosulphate solution must be used all the time as well.
Prediction
I predict that the higher the concentration of thiosulphate, the quicker the solution will change and the cross will disappear. I predict this because in order for a reaction to occur the thiosulphate atoms have to collide with the hydrochloric acid atoms, but because water is present it slows this down. The more water the more obstacles there are for the atoms, this means that a increase in water increases the amount of time taken for a reaction to happen.
Table of results
Conclusion
After carrying out the experiment, my results proved one thing-that there is a relationship between the reaction time and the solution.
It appears that the more concentrated the solution the quicker the reaction because the times for a higher amount of water are longer than the ones for less water.
As my graph shows, the rate of reaction(time) decreases as the percentage of concentration increases. This is shown on the graph by the downward slope of the line. It also shows that when double the amount of thiosulphate is used the reaction times double(20 ml of thiosulphate takes on average 66:68 seconds, 40 ml of thiosulphate takes an average 31:725 seconds, this is very close to half) On my first graph there are no miscellaneous results, however on my second graph there is one. This is due to an anomalous result.
On my second graph the line is steadily increasing, as the concentration increases from 0.04-0.2 molars the rate of reaction also increases. This also shows that the rate of reaction is determined by the concentration of the solution.
Analyses
For a reaction to occur the hydrochloric acid molecules must collide with the Thiosulphate molecules, because there is water present this is made harder(see diagram below). The more water in the solution , the less chance of a collision therefore it takes longer for the molecules to collide and takes more time for the solution to change from clear to milky. If more hydrochloric acid or more thiosulphate was added then the reaction time would speed up, and the opposite would happen if more water was added. I think that this relationship would continue outside the concentrations I have tested, and if I had more time as a extra experiment I could test larger and smaller concentrations to see if the same reaction times and theory occurs.
Evaluation
Most of my results are accurate except one. I know they are fairly accurate because they all plot well on graphs(this means that when I drew my line of best fit most off/all the results fit). I have only got one that doesn’t fit into my line of best fit (graph 2)I have circled this result. Its strangely inaccurate, so my only guess would be that somewhere in my experiment I made a miscalculation and that’s why I have ended up with anomalous result.
I know my results are accurate due to them being within 10% off each other. I worked this out by:
Volume of thiosulphate x original concentration of sodium thiosulphate
Total volume of
Thio+Water
In my experiment there were a few difficulties, one was the measuring of the liquids, each one needed a different measuring cylinder to get the amount to the correct degree of accuracy. Another problem was the size of the cross, obviously a bigger cross take longer to be obscured than a smaller one.
I could overcome the first problem by using the correct measuring cylinder, I could use specific one for certain amounts. Or I could use a measuring jug
For the second one I could use trial and error to find out which cross would be more suitable for my experiment. Or instead of using an X, I could use a single block of colour so It would be easy to see when it disappears, however a single block of colour would be a lot bigger than a small cross so would take a few more milliseconds to disappear.