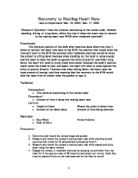
Table 2: Average HR at Each Time and Each Position (Boys Age 13-15)
Table 3: Average HR at Each Time and Each Position (Girls Age 14-15)
Table 4: % Recovery of RHR for Boys Age 13-15
Graph 1: Recovery Rate and Percent Increase for Boys (age 13-15)
Table 5: % Recovery of RHR for Girls Age 14-15
Graph 2: Recovery Rate and Percent Increase for Girls (age 14-15)
Table 6: Heart Rate Changes for People Ages 67-74
Table 7: Average HR at Each Time and Each Position for All Subjects Ages 67-74
Table 8: % Recovery of RHR for All Subjects Ages 67-74
Graph 3: Recovery Rate and Percent Increase for Subjects Ages 67-74
Data Processing:
In order to find the Percentage Recovery to RHR, there has to be a series of steps to go through. I will demonstrate one example for each step for deeper understanding using the data from Patrick and Damian.
-
Step 1: Averaging the Results
In this step, you must find the average for the results of each HR at each time after the exercise. You must add up all of the results in the same section, and then divide them by the number of results you added up.
Ex.
-
Step 2: Finding Percent Increase
In order to find the percent increase, you need to use the formula:
% Increase= (After- RHR)/ (RHR) x 100
Using the averages above, I will make an example for the standing position:
Example:
% Increase= (After- RHR)/ (RHR) x 100
% Increase= (158-82)/ (82) x 100
% Increase= .926... x 100
% Increase= 92.6 %
So basically, all you need to do is plug in the right values for each part in the formula, and you’ll have the percent increase from the RHR to the Heart Rate right after the exercise.
-
Step 3: Finding % Recovery of RHR:
When finding the % Recovery of RHR, you will have to plug in the correct values into the formula:
%Recovery of RHR= (After-HR)/ (After- Resting) x 100
Using the averages I found in Step 1, I will show an example of this formula, and the % Recovery rates during the standing part.
Ex.
Using the techniques shown in the steps above to actually process the data, a conclusion was reached that the physical position of the body does effect the time it takes for the HR to return to the RHR after moderate exercise, however, it may be that it makes more of a difference to some people than others.
Conclusion:
The hypothesis is rejected. It stated that the physical position that would allow the body to return to its RHR in the least amount of time no matter what age or what gender was the sitting position. In the experiment, we were meant to do step up and down on a chair 20 times over the course of two minutes. After the exercise, we were supposed to take our pulse once standing up, recording the HR every minute for 4 minutes, once sitting down, and once laying down. After everyone had recorded their data and posted it, we were meant to find the percentage of the RHR that was recovered within the time period of 4 minutes we were given. We could then group the data by gender or by age group. In order to get more accurate results, and make more connections, I did both. After looking at the data in both the different genders and age groups, it can be said that, without a doubt, the physical positioning of the body after exercise DOES affect the time it takes to recover to the RHR. When looking back at the hypothesis, the basic principle was right. Although the guess for the position may not have been correct, it still stated that some positions would allow the RHR to recover faster than others which is what the research question was essentially asking. However, I don’t believe that the different positions have the same effects on everyone. When comparing the graphs of the teenage boys and girls (in data collection) it can be said that the physical position doesn’t affect the boys as much as the girls. This is shown by the fact that almost all of the lines in the boys’ graph nearly trace one another, whereas in the girls’ graph, the lines are going on different paths. I think that this can tie into fitness. If a person is more fit, they are less prone to have their time to RHR vary with different positions because the heart is use to physical activity, and it is strong enough to pump at the same rate even if there are different outside forces, such as the forces of gravity, that may affect others more. The fitness hypothesis would also be valid because when looking at the graph for the seniors, because it also has somewhat askew lines. I think that out of all of the groups tested, the teenage boys would tend to be the fittest. Even though my hypothesis may not have been correct, I feel that its basic idea and principle was correct and it led me to think even harder about the data and come up with a new guess. But, referring back to the original question, I do believe that the physical positioning of a body affects the time it takes the HR to recover back to its RHR, but I also believe that it affects some people (possibly the less fit) than others.
Evaluation:
There were many factors in this experiment that could have caused us to receive inaccurate results and essentially, driven us astray from receiving what could have been considered a “right answer”. The fact that some people (including myself) had to complete the exercise and HR recordings on their own at home may have tampered with the results. Most everybody who completed in class used the same size chair; however the people doing it at home might have used a chair of different measure. If the chair was higher than that of the other students, you could have been pushing yourself harder, and your heart rate would essentially be higher than your classmates. If the chair was too low, the amount of energy put out would be less than that of classmates, thus meaning that your heart might not have worked as heard and your HR would be lower. Also, the fact that we only measured our pulse for 15 seconds may have led to inaccurate results. Imagine this, if we accidentally miss one beat at the beginning, and one beat at the end, that is actually 8 beats less than our real Heart Rate. In order for more accurate results, the time frame in which we measured our pulse would have to be longer. Another thing is the speed at which we did our exercise. If the speed of our up-downs was not kept constant, again the results could have been tampered with. If the speed was going very quickly, and let’s say that 15 of the up-downs had been completed in the first minute, only five would need to be completed in the second minute. During the second minute, since the workout is going very slow, the heart is given time right there to recover while still completing the desired amount of reps. Unless we ensure that the pace is constant, this could pose a threat to the results. A more important factor that is one we tend to overlook is the one of human error and competition. Maybe somebody may lie about their results just to get a lower heart rate than their friend, or maybe someone was unable to read their pulse that well. We need to remember that sometimes human beings make errors, and sometimes we don’t always act ethically. Also, the uneven ratio of boys: girls could have affected the girls’ results. Since there are less of them, if one person’s results all had very high numbers, it would affect the averages more than if one boy had very high numbers. For the results to be even more accurate there would need to be an even number of both genders. Although there is no such thing as perfect, it is important that we point out mistakes made so that we can learn and improve from them the next time.