124.8 sin 10° = height (21.7cm)
124.8 sin 15° = height (32.3cm)
124.8 sin 20° = height (42.7cm)
124.8 sin 25° = height (52.7cm)
124.8 sin 30° = height (62.4cm)
I know that at 90° gravity is roughly 9.8m.s.-2. By dividing 9.8 by 90 and
multiplying it by whatever the angle is, I can effectively get the acceleration
of the ball due to gravity.
9.8 / 90 = 0.108 È 0.108 * 5 = 0.54
9.8 / 90 = 0.108 È 0.108 * 10 = 1.08
9.8 / 90 = 0.108 È 0.108 * 15 = 1.62
9.8 / 90 = 0.108 È 0.108 * 20 = 2.16
9.8 / 90 = 0.108 È 0.108 * 25 = 2.70
9.8 / 90 = 0.108 È 0.108 * 30 = 3.24
The acceleration of the ball for a 5° angle is 0.54m.s.- , for a 10° angle it is 1.08m.s.-2 , for a 15° angle it is 1.62m.s.- 2, for a 20° it is 2.16m.s.- 2, for a 25° angle it is 2.70m.s.-2 , and for a 30° angle it is 3.24m.s.-2 . As the mass of the ball does not affect the acceleration, all the accelerations should be
the same.
Steepness of ramp / ° 5 10 15 20 25 30
Predicted acceleration / m.s-2 0.54 1.08 1.62 2.16 2.70 3.24
RESULTS
Changing the Mass of the Ball
Mass of the Ball (g) 6.06 7.30 8.63 28.07
Acceleration (m.s.-2) (Reading 1) 0.50 0.53 0.56 0.54
Acceleration (m.s. -2) (Reading 2) 0.52 0.52 0.55 0.53
Acceleration (m.s. -2) (Reading 3) 0.54 0.50 0.52 0.53
Average/ (m.s. -2) 0.52 0.52 0.54 0.53
Changing the Angle of the ramp
The angle of the ramp (ÿ) 5.0 10.0 15.0 20.0 25.0 30.0
Acceleration (m.s. -2) (reading 1) 0.54 1.01 1.60 2.10 2.71 3.23
Acceleration (m.s. -2) (reading 2) 0.53 1.03 1.62 2.18 2.63 3.26
Acceleration (m.s.-2) (reading 3) 0.53 1.12 1.64 2.19 2.70 3.23
Average (m.s. -2) 0.53 1.05 1.62 2.16 2.68 3.24
Conclusion
As you can see from the graph as the angle of the ramp goes up so does the acceleration and it goes up very steadily the smallest gap between readings is 52 m.s.-2 while the biggest difference between readings was 57m.s.-2. These results show that when the angle of the ramp is increased the speed increases in turn whereas the acceleration between the 5ÿ intervals is roughly the same around 54m.s. -2. Between these intervals the acceleration between 5ÿ angles does not change but the speed does. I predicted these accurately by using my previous knowledge, which is that at 90ÿ, objects accelerate at 9.8m.s. -2 so by dividing the acceleration at 90ÿ by 90 you get the acceleration at 1ÿ then you can multiply that by the angle e.g. at 10ÿ you would multiply 0.108 by 10 to obtain an acceleration of 1.08m.s. -2.
When the variable was the mass of the ball, the times of the accelerations were all in a range of 0.02m.s. -2. This reinforces the fact that all masses, ignoring air resistance, accelerate at the same rate. This is because the greater the mass of an object the more force it needs to accelerate it. In my prediction I was very close to the actual results, as I knew that all objects accelerated at the same rate and as I knew that at 90ÿ it accelerated at 9.8m.s-2 so by dividing the acceleration at 90ÿ by 90 I could tell the acceleration at 1ÿ would be 0.108m.s.-2 so by multiplying by 5 I could find out what the acceleration should be for all of the ball bearings. When the variable was the mass of the ball I had to repeat one of my readings when the ramp slipped
Evaluation
I think the experiment was carried out successfully when I drew my graph I could spot no anomalous results. If I were to do this experiment again I would use a smoother ramp, the ramp that I used may have caused the ball to bobble and this would be remedied with a smoother ramp. When the variable was the mass of the ball I had to repeat one of my readings when the ramp slipped this should not have been a problem but I did not fasten the clamp enough.
Future experiment improvement
I could take more readings to iron out any anomalous results and get a more definite average.
In a follow-up experiment I could see how different materials reacted in this experiment.
In a further experiment I could see what affects an obstacle in the middle of the ramp would have.
Trolleys and Ramps
Skill Area P: Planning experimental procedures
Introduction
A trolley is pushed to the top of a ramp, the summit being 20cm from the ground, and then is released. It rolls all the way down the ramp, of 2 metres, before it collides with the wall at the bottom. A couple of keen scientists thought it would be interesting to record the time taken for the trolley to reach the bottom and then calculate its average speed. They let the trolley fall down the ramp two more times after that, just to make their results more accurate. They also wanted to investigate if the height of the summit made any difference to the average speed, so they raised the ramp to 30cm and pushed the trolley down the ramp again and recorded the time.
Basically I have been asked to act as the two enthusiastic experts and test, as a primary objective, to see if the height of the summit affects the average speed at which the trolley travels down the ramp.
Based on my existing scientific knowledge, I know that this experiment depends on a certain type of energy being converted into another type. When the trolley is raised to the top of the ramp, it gains a certain amount of potential energy - this is converted into kinetic (movement) energy as the trolley moves down the slope. Too see what factors may affect the way the experiment turns out, it may be useful to look at the formula for potential energy.
P.E = mhg (where m=mass, h=height and g=gravity)
Obviously, the more potential energy the trolley has got, the faster it will move down the ramp. So, theoretically, the only factors that can affect this experiment are the height and the mass and the gravity. Since we can only possibly conduct this experiment on Earth, the gravity will always stay constant - about 10m/s2 (or 9.82m/s2 to be more precise). The only factors left are the variables I will be experimenting with in this investigation
· Primary Experiment - I will be investigating, by varying the height the summit of the ramp is raised off the ground, if the average speed increases or decreases.
· Secondary Experiment - I will be investigating if the average speed changes by adding extra mass to the trolley.
There will always be smaller forces that could slightly affect the result, such as friction between the ramp and the trolley's wheels, and air resistance. There is no way I can control any of these factors, but they shouldn't affect the results so much as to give completely anomalous readings for each experiment.
Planning
When planning my experiment, I will need to take into consideration the following points:
· Safety
· Fair testing
· Equipment
· How many results I will take
· What range of variables I will experiment with
Safety
With this straightforward experiment there is not much that needs to be taken into consideration. No harmful substances are being used, neither are flames, solvents, atomic-reactors or insurance salesmen so all-in-all a relatively safe experiment. Obviously we will need to take precautions when increasing the mass of the trolley and make sure that all the weights are securely fixed to it by using sellotape, string etc. Especially when the trolley reaches high speeds, the likelihood of weights falling off is increased and this could be potentially harmful to an innocent on-looker. Also at the bottom of the ramp some sort of barrier will need to be placed to prevent damage to the trolley as it hurtles off the edge, or to thwart potential harm to any unsuspecting pedestrian/small animal. That's basically it, the rest is all common sense.
Fair Testing
As with all scientific experiments, only one variable must be altered at one time. All the rest must remain constant to ensure good sensible results. By using present knowledge, I know that the following factors can affect the outcome and must be controlled:
· Height of ramp - as this is included in the formula for potential energy, the height of the ramp should affect the speed of the trolley in some way. I will be modulating this variable in the primary experiment, but it should be constrained to a single height in the secondary experiment.
· Mass of trolley - mass is also included in the formula for potential energy and so could affect the speed of the trolley one way or the other. As with height, this will be varied but only in the second experiment. With the primary experiment we should constrain it simply by not adding any weights to the trolley and always using the same trolley to collect each result.
· Gravity - the last portion of the formula for potential energy is gravity, which will affect the outcome if it is increased or decreased. The way to maintain this factor is to simply stay on the same planet.
· Friction - I mentioned that the only factors that should affect the outcome of the experiment would be mass, height and gravity - because they make up the formula for the potential energy. But other factors may use some of this energy when it is being converted into kinetic (movement) energy as the trolley moves down the ramp. The friction between the wheels of the trolley and the surface of the ramp can 'steal' some of the energy used to move the trolley and convert it to heat instead. This can slow down the trolley, but only very slightly. To maintain the same friction for all the results we should use the same material for the surface of the ramp, and the same material for the wheel of the trolley. No grease should be added to lubricate any equipment.
· Air resistance - there is very little we can do to control this factor, and its effects would be so insignificant it may not matter. Basically, we just need to make sure we have the same trolley and we'll have to mind we don't accidentally attach a parachute to its back end.
· Water resistance - just to point out the obvious, it wouldn't be recommended to conduct one experiment in air and one in water...water is far denser than air and will create a stronger atomic 'barrier' which will drastically slow down the trolley.
With these points in mind it is essential that we must keep the same trolley, use the same ramp and keep the mass constant in the primary experiment; and the height constant in the secondary experiment. We will also have to keep the length of the runway the same, just so the trolley has enough time to accelerate.
Ranges and amounts
To make this investigation successful, we must choose a sensible range, and amount, of readings to record in order to come up with a useful and informative outcome. For example, in the primary experiment it would be pointless to experiment with heights ranging from 1cm-2cm because the speed difference would be minor. Instead a more sensible range, let's say from 10cm-50cm, would be appropriate and should yield some interesting results. We could take readings every 10cm, and take a minimum of three readings on each height to work out an average (this makes the end result more accurate).
For the secondary experiment, I chose to be working with weight going up by 200g each time. Five or six is always a sensible number of results to obtain, so I will go up to about 1kg. Again, a minimum of three readings should be taken on each weight for a mean average to be taken. We may need to take results again if a factor that should be kept constant is accidentally changed, or if the trolley is knocked for example. On the other hand, it may be interesting to keep these anomalous results so they can be explained in the analysis. Below is a clear list of the ranges and amounts in my two experiments.
Primary Experiment-three tests on each 10cm)
20cm )
30cm > Keeping weight constant
40cm )
50cm )
Secondary Experiment-three tests on each 200g )
400g )
600g > Keeping height constant
800g )
1000g )
Equipment
Before we begin, we will need a list of equipment for the experiment to ensure it all runs smoothly:
Trolley - To roll down the ramp
Ramp - For the trolley to roll down
Metre Stick - To measure out 2 metres on the ramp
Chalk - To mark the start and finish lines
Stop Watch - To time the trolley
Barrier (bag) - To stop the trolley flying off the table
Books - For one side of the ramp to rest on, to increase the height of the ramp summit
Data Collection Sheet - To record our results on
Stationary - To write our results down with
Below is a diagram of how the equipment will be set up and used.
Using this equipment, we can easily obtain results with a high degree of accuracy. The usage of books means we can increase the height by any amount because some books are thicker than others are. We can get the height of the ramp at the start line almost exactly on the said measurement by simply moving the pile of books forwards or backwards fractionally. Perhaps manually timing the trolley with a stop-watch is not the most accurate way of recording the time taken, but we may find a better alternative when we come to the practical.
Why?
From this experiment I expect to find out what factors affect the speed of a body when no manual force is applied to them (i.e. pushing them). This experiment is being conducted to prove the potential and kinetic energy formulae which, once completed, can be used to calculate exactly the results of any situation using these theories. For example, the planning of a rollercoaster - if we prove the formulae, they can be applied to find the exact speed of the train at the bottom of a raised track x metres in height.
method
I have decided to produce a step-by-step guide for each experiment just to ensure that when we actually come to conducting the practical work, it runs flawlessly. This will also help us conduct fairer tests as we will be following the same set of steps each time we collect a result.
Primary Experiment
1. Set out equipment as shown in the diagram
2. Ensure the height at the start line (the summit of the ramp) is 10cm using the metre stick
3. Ensure there are no extra weights attached to the trolley
4. Hold the trolley with its front touching the start line
5. Simultaneously start the stop clock and release the trolley (be careful not to push it or exert any extra force on it)
6. Stop the clock when the front of the trolley reaches the finish line
7. Record the time taken for the trolley to reach the finish, next to the relevant height, in a table
8. Repeat from step 4 twice more so you end up with three results for the same height then continue onto step 9
9. Add all these results together and divide the answer by three to obtain the average.
10. Record this average in the table
11. By placing more books underneath the raised end of the ramp, increase the height at the summit by 10cm. Use the metre stick to check
12. Repeat from step 4 until you have obtained results for height from 10cm through to 50cm
Secondary Experiment
1. Set out equipment as shown in the diagram
2. Ensure the height at the start line (the summit of the ramp) is 10cm using the metre stick
3. Add 200g of weights onto the trolley and affix them securely with tape in the middle, so they do not interfere with the wheels.
4. Hold the trolley with its front touching the start line
5. Simultaneously start the stop clock and release the trolley (be careful not to push it or exert any extra force on it)
6. Stop the clock when the front of the trolley reaches the finish line
7. Record the time taken for the trolley to reach the finish, next to the relevant weight, in a table
8. Repeat from step 4 twice more so you end up with three results for the same height then continue onto step 9
9. Add all these results together and divide the answer by three to obtain the average.
10. Record this average in the table
11. Repeat from step 3 until you have results for weights 200g through to 1kg
By following these guidelines exactly, and not doing anything extra, we should conduct a very fair test.
Predictions
Primary Experiment
As I mentioned in the Introduction, the experiment is based on the potential energy at the top of the ramp being converted into kinetic energy at the bottom. I've taken this theory from the source book 'Physics For You' (Keith Johnson) on page 115 where it simply explains the fact in a basic diagram of a diver climbing to the top of a board. He uses 6000j to climb the ladder so his potential energy at the top is 6000j. When he jumps off the board and falls, his potential energy is proportionally converted into kinetic energy. Halfway down, there is equal potential energy as kinetic (3000j each) and at the bottom all the potential energy has been converted into kinetic energy. Using this theory, we can say:
Potential Energy (at the top) = Kinetic Energy (at the bottom)
Page 118 and 119 of the same book explains how to calculate potential and kinetic energy:
"A weight lifter is lifting a mass of 200kg, up to a height of 2 metres. We have already seen how to calculate the potential energy of his weights:
Potential energy = work done
= weight x height lifted
But here on Earth, weight (in N) = mass x 10 so:
(g has a different value on other planets)"
The book also tells me the formula for kinetic energy is:
K.E = ½ x mass x velocity squared
K.E = ½mv2
Knowing this we can write:
P.E = K.E
mgh = ½mv2
The formula can be simplified
20h = v2
SQRT(20h) = v
This formula will give us the average velocity for the trolley going down a ramp of h metres high. Once we have found this we can actually use the equation for average speed to find out how long it will take the trolley to reach the finish line and actually produce a theoretical result prior to conducting the experiment. Obviously, this won't be necessary for a simple prediction, but it shows that the higher the ramp is raised, the higher the velocity of the trolley will be resulting in a quicker time to reach the finish line. I can also predict from this formuIa, the shape of the graph v against h. As h increases uniformly, by lets say 10cm each time, v will increase too - but not in proportion. This is due to the square root in the formula that we have to use to find v. The higher the height goes, the less gap there will be between the velocity of the present and previous heights. The graph will look something like this:
Therefore, I predict
Increase in height of ramp = Increase in velocity of trolley
Secondary Experiment
Again, for the secondary experiment, we just need to examine the equation that states potential energy at he top equals the kinetic energy at the bottom.
P.E = K.E
Mgh = K.E
Now looking at the equations at this stage, it seems sensible to say that a larger mass will result in more kinetic energy, and hence a faster velocity. But lets look at the formula for kinetic energy.
Mgh = ½mv2
Now we can see here that although a larger mass will indeed result in a larger amount of potential, and therefore kinetic, energy it will not result in higher velocity. BOTH sides of the equation contain mass, which simply means they cancel each other out.
Gh = ½v2
Therefore I predict that there will be no significant change in velocity when the weight of the trolley is altered.
Skill Area O : Obtaining evidence
This section is mainly putting our planning into action, and hence is nearly all practical work so not much written work will be produced.
Primary Experiment
When we came to conduct our experiment, we decided to alter our plan and do two experiments. One using a stop-watch timer and one using a light gate to record the velocity of the trolley for more accuracy.
Manually timing the experiment:
Using a light gate and computer software:
Secondary Experiment
As with the primary experiment, we used a light gate to collect another set of results.
Manually timing the experiment:
Using a light gate and computer software:
We repeated ALL results three times, even when using a light gate, to improve the accuracy of our experiment.
Skill Area A : Analysing evidence and drawing conclusions
Primary Experiment
The graph clearly shows the increase in speed as the height of the ramp greatens, but not in a proportional manner. The slight curve suggests that another force is acting on the trolley and not permitting it to increase speed uniformly.
Again, when using the light gate, the results clearly show that there is a definite increase in speed as the height of the ramp expands. The curve is slightly more prominent, and the peak speed reached in this part of the experiment is almost double of that in the last.
Conclusion
My prediction was proved correct as the graphs clearly show that the speed does indeed increase when the ramp is raised higher. This is due to the fact that more potential energy is given to the trolley as it is raised higher - height is part of the formula that makes up P.E:
P.E = mgh
P.E = mass x gravity x height
So the higher an object goes, the more gravitational potential energy it gains. When it falls, it's potential energy is converted into kinetic energy and; since energy can neither be created or destroyed, only converted; it will move at a faster speed.
The vast difference in the manual timing speed and the light gate speed is probably due to reaction time. The computer is able to record the speed far more accurately than we can.
So, to sum up, as you lift an object to a height, the chemical energy stored in you (which comes from the food you eat) is converted into gravitational potential energy. Obviously, the higher you lift the object, the more energy you are using and therefore the more potential energy the object is gaining. Potential energy is converted into kinetic energy completely so the object when released will move at a faster rate depending on how high it is lifted.
Height does affect the speed at which a trolley travels down a ramp
The graph shows no pattern. The speed stays roughly around the 0.9m/s mark except for a suspected anomaly at the beginning.
The graph again shows no significant increase in speed as mass increases, but there is a slight increase nevertheless. It is again almost double the speeds recorded in the manual timing experiment.
Conclusion
The first graph shows a wavering line, going up and then down. This is expected from a manual timing experiment as results should vary depending on our reaction time. There is an anomalous result with no weights added - this was due to the fact that the trolley hit the side when travelling down the ramp, losing a lot of its energy on friction and a bit on sound which drastically slowed it down, as depicted in the graph. Other than this, the results tend to stay around the same speed.
The second graph does show a little, but definite, increase in speed. This is caused by the decrease in friction as more wheels are added. The extra force pushing down on the wheels made them less prone to losing their energy on the surface of the ramp - but this effect is only very slight. If we were to conduct this experiment in a place with no air resistance and no friction, we would see that the speed of the trolley stayed perfectly constant as mass plays no part in the equation of potential energy being converted into kinetic.
P.E = K.E
Mgh = ½mv2
Mass x gravity x height = ½ x mass x velocity2
Gravity x height = ½ x velocity2
Mass is cancelled out and theoretically has no impact on the speed of which an object travels when it is given gravitational potential energy. Galileo proved this with his famous experiment-
"...In the 17th Century, Galileo was the genius who looked at this phenomenon with fresh eyes. Legend has it that he climbed to the top of the leaning Tower of Pisa and dropped two cannon balls over the side. One cannon ball was heavier than the other was. Galileo's professor was highly sceptical about Galileo's idea and so Galileo had the professor lie at the bottom of the tower with his ear to the ground! This was so that the professor could listen out for the two thuds as one cannon ball hit the ground before the other one. The professor was dismayed to only hear one thud - they had hit the ground at the same time!.." Taken from Bev Aldridge's PGCE Notes
You may say a feather drops slower than a cannon ball, but it only flutters to the ground because of air resistance. Air resistance acts on everything that moves through the air and is a force that opposes motion, i.e. it makes a moving body slow down. Some shapes result in less air resistance than others - a feather experiences much, and a coin very little. Thus when a coin and a feather are dropped from the same height in a vacuum, they both hit the ground at the same time.
This is an important principle in science. If air resistance is the same for two objects that are dropped, they will gain speed at the same rate as each other even if one is much heavier than the other is. So if they are dropped from the same height, they will hit the ground at the same time as each other.
This is expressed scientifically by saying that acceleration due to gravity on the earth's surface is constant.
Mass has no effect on the speed at which a trolley travels down a ramp.
Skill Area E: Evaluating Evidence
The experiments went very well and ran efficiently, thanks to the plan we had drawn out beforehand. So well, we even had time to conduct another set of experiments using a light gate and a computer package. This extra equipment made us sure that our results were accurate and could be counted on. Thanks to the rapid speed of light, this device is extremely sensitive and can measure speed to a very fine degree. For our experiment, we didn't require it to be as accurate as the system allowed so we rounded the results off to three significant figures. With our second set of results we were certain they were reliable and could be counted on. Unfortunately, the same couldn't be said for the first set of experiments where we manually timed the time the trolley took to travel down the ramp. Due to human error and reaction time, these results could not be relied on completely, but did give us a rough idea. If we were to conduct the experiment again, I would save time by just producing results using the computer system with light gate.
There was one result that did not fit the pattern, and was too extreme to be our reaction time. This was the result for 0g on the manually timed weight experiment. It was suspiciously lower than the others were, and we agreed that it was the fact that the trolley hit the side wasting its energy on friction. When we noticed the trolley had hit the side, we decided to take the result anyway just to prove the point.
Thankfully, we had arranged to collect a sensible amount of results, which gave us enough information to draw a conclusion from. I would not choose to change the amounts if I conducted the experiment again because we managed to achieve maximum outcome in the time allotted.
If I were to do this experiment again, I would experiment with different surfaces of ramp. I wasn't expecting the mass to have any difference on the speed but, even with the light gate, results showed a slight increase. I assume this was due to friction and would like to investigate its properties. Also I would use a trolley than travelled in a straight line! The main problem we found in our experiment was that the trolley kept swaying to the sides, creating a longer journey and most of the time hitting the edge. This wasted a lot of time as we had to conduct the result again. This also could have been due to uneven floor, so a spirit level may come in handy.
To extend this work, we could conduct Galileo type experiments, but take them a step further. Perhaps, if we had the access to the right equipment, we could drop weights from different heights in a vacuum (i.e. no air resistance), calculate the speed using light gates and see if it produces theoretically perfect results. We could also try eliminating any other opposing forces, such as friction, by polishing surfaces etc. and noticing if this changes the results.
To take the potential/kinetic energy element even further, we could look into elastic potential energy and see if it works on the same principle as gravitational potential energy. A simple experiment, such as pulling a trolley back against an elastic band and letting go to see how far it goes, or what speed it goes at would be of interest. And we could also look into what parameters effect the outcome, such as distance elastic is pulled, weight of trolley, type of surface etc.
All these things would help further our progress in this area of physics and help our understanding of the subject.
Bibliography
PHYSICS FOR YOU - Keith Johnson
WESTMINSTER COLLEGE RESOURCE
PGCE NOTES - Bev Aldridge
FORCES IN ACTION
Experiment to Find Accleration due to Gravity
Aim
The aim of my experiment is to measure the earth´s gravitational field strength, which is also the acceleration due to gravity. This involves mass, which is the amount of matter an object contains and weight which is the force of gravity pulling down on a object with a mass. Mass is measured in Kg and weight is measured in Newton´s. Gravity is the weakest of the four fundamental forces, yet it is the dominant force in the universe for shaping the large scale structure of galaxies, stars, etc.
The earth´s gravitational field strength is calculated by the weight (N) / Mass (Kg), therefore the earth´s gravitational field strength (g) is measured in (N/Kg). As an object is in free-fall it accelerates at the rate of g. The gravitational field strength is measured by doing an experiment with a trolley rolling down a tilted runway with the force of g causing it to accelerate down the slope.
Hypothesis
Isaac Newton firstly discovered gravity when an apple fell on his head. He then discovered that every object has a mass and that two masses attract each other. This attraction has a gravitational field strength, Newton wanted to calculate the gravitational field strength of the earth. There is a pendulum that involves g and calculates T the time the pendulum will swing for, the equation is stated below:
T = 2  l/g
Where l is the length of the pendulum. The pendulum is shown in diagram 5. Through this Isaac Newton discovered that g = 9.81 N/Kg. This is now a well now fact and is accepted as the earth´s gravitational field strength.
I will use a different experiment to try and prove that g = 9.81 N/Kg. I predict when I do the experiment as shown in Diagram 2, I will find g = 9.8 N/Kg and if the experiment is accurate and reliable enough I may be able to show g = 9.81 N/Kg but I would be satisfied with the answer accurate to two significant figures.
Referring to the diagram:
ma = mg sin - F
Divided by mass
a = g sin (-F / m)
Then put into the equation of a straight line
y = mx + c
The parts equation represent as follows, y = y axis, x = x axis, m = gradient, c = intercept. When this is put into the equation of a straight line the lines are replaced as follows, a = y, sin = x, g = m, (-F / m) = c. When the results are put into a graph , I can find g by finding the gradient of the line on the graph as shown in Diagram 3.
Definitions
Gravity Force , Fgrav
The force of gravity is the force at which the earth, moon, or other massively large object attracts another object towards itself. By definition, this is the weight of the object. All objects upon earth experience a force of gravity which is directed "downward" towards the center of the earth. The force of gravity on earth is always equal to the weight of the object as found by the equation:
Fgrav = m * g
where g = 9.8 m/s2 (on Earth)
and m = mass (in kg)
Normal Force, Fnorm
The normal force is the support force exerted upon an object which is in contact with another stable object. For example, if a book is resting upon a surface, then the surface is exerting an upward force upon the book in order to support the weight of the book. On occasions, a normal force is exerted horizontally between two objects which are in contact with each other.
Friction Force, Ffrict
The friction force is the force exerted by a surface as an object moves across it or makes an effort to move across it. The friction force opposes the motion of the object. For example, if a book moves across the surface of a desk, then the desk exerts a friction force in the opposite direction of its motion. Friction results from the two surfaces being pressed together closely, causing intermolecular attractive forces between molecules of different surfaces. As such, friction depends upon the nature of the two surfaces and upon the degree to which they are pressed together.
Implementation
I will use the following apparatus in my experiment to find "g":
A wooden trolley- the trolley will be able to roll down the runway with a negligible amount of friction acting upon it as it rolls down.
A wooden runway- the runway is wide and long enough to enable the trolley to have a sufficient length run and also be wide enough so the trolley won´t touch the edges.
A light gate and picket fence- the picket fence will pass through the light gate and the velocity at which the picket fence passed through the light gate can be measured.
A CBL2 data logger- this will be connected to the light gate , the data measured by the light gate such as the velocity and time at which the picket fence passed through the light gate can then be displayed as a graph on the data logger.
Blue-tack- this was used to hold the picket fence securely to the top of the trolley, this is so that when a trolley does a run, the picket fence will pass through the light gate and therefore measure the velocity and time of the trolley.
Books- the only resource that was available to elevate one end of the runway to slope the runway was books, so I used different amounts of these to alter the height of elevation and therefore altering the angle of the runways slope.
A metre rule- this was used to measure the height of elevation on one end of the runway and the length of the runway.
A set square- this was used to make sure the picket fence was perpendicular to the trolley and the light gate was perpendicular to the picket fence on the trolley.
A clamp stand- this was used to hold the light gate up above the runway so it could allow the picket fence to pass through it.
The apparatus were set up as shown in Diagram one. The runway would first be put at a very small slope to start off the experiment. The picket fence was checked and adjusted to make sure it was inline with the trolley and not at an angle to the trolley. I then checked and adjusted the light gate to make sure the picket fence could pass through the light gate without colliding with it and that it was perpendicular to the light gate. Every time a run was done the apparatus was re-checked to make sure the apparatus was still accurate.
Each time the angle of slope was increased, the position of the light gate would have to be raised so the picket fence would not hit it. The angle of the light gate would also have to be changed so it is still perpendicular to the picket fence. Each run I would note down the results from the data logger. Three runs were taken for each runway angle and the averages of those three were put into the results. The books were used to increase the angle of the runway.
If there was an occurrence that would cause a incorrect result such as the trolley hitting the side of the runway, I would do the run again and ignore the results I got from the run that hit the side of the runway, as the increase in friction from the trolley hitting the side would cause the velocity of the trolley to significantly decrease. I also made sure that the picket fence was fully cutting the light gate beam each run so the reading on the data logger would be accurate. The apparatus I use was the same through out the whole experiment to keep things like the mass and friction of the trolley upon the runway.
The factor of safety is very important in every experiment. Unsafe experiments tend to be inaccurate so fully meeting all of the safety requirements increases the accuracy of the experiment. In this particular experiment I found there to be a few safety factors that needed to be taken into consideration as well as the safety rules of the laboratory. The first safety factor I found was the angle of the runway. I decided that the angle of the runway should be kept fairly small because I wanted to limit the speed of the trolley as it rolled down the runway so it wouldn´t travel to fast. This is important because at the bottom end of the runway the trolley had to be caught by hand, if it was travelling to fast the person stopping it may be injured.
The runway had rails along the side so the trolley would not fall over the edge of the runway and break, the trolley was also caught at the end of the runway so it would not hit the floor and break. The light gate was securely fastened to the clamp stand and the picket fence was attached to the top of the trolley so it wouldn´t fly off and hit somebody while it speeded down the runway. The runway also had rubber grips at the bottom end of the runway, this was so it would grip onto the table and wouldn´t slide off the table and hit somebody.
The reliability and accuracy of the experiment is very important because inaccurate data will cause the results and the graph to be incorrect. To increase the reliability and accuracy of the experiment I checked and adjusted the apparatus every time the trolley did a run so the apparatus were always set up properly and therefore always give the correct reading. The measurements of the runway such as its width and length were measured to the nearest centimetre using the metre ruler.
The CBL 2 data logger measured the velocity of the trolley to four decimal places and the time at which it passed to three decimal places. The CBL 2 data logger was used with the light gate and picket fence to measure the velocity and time instead of a traditional ticker timer. Although the ticker timer is accurate, it presents a higher possibility for error when measuring the distance between the dots on the ticker tape, plus the accuracy of the measurements could not be as accurate as that of the CBL 2 data logger. The measurement of the angle of the runway was also measured using trigonometry instead of using an angle measurer , as I can measure the height and length of the runway more accurately than the angle of the runway.
Results
These tables are the results from my experiment. The figures they contain are the average of the three runs I did for each angle. The first table shows the length and height of the runway and also how they were used to calculate the angle of the runway. The second table shows the initial velocity, final velocity, initial time, final time and how they were used to calculate the acceleration of the trolley.
Table One
Experiment Number Length of Runway,
L in metres Height of Slope,
H in metres Angle of Runway,  = Tan (L/H), in degrees
1 2.46 0.09 2.10
2 2.46 0.13 3.02
3 2.46 0.17 4.07
4 2.46 0.27 6.38
5 2.46 0.33 7.76
6 2.46 0.46 10.72
Table Two
Experiment Number Initial Velocity, u in metres per second Final Velocity, v in metres per second Initial Time, ti in seconds Final Time, tf in seconds Acceleration, (v-u) / (tf-ti)
in (m/s)/s
1 0.5473 0.6524 0.0936 0.5081 0.25
2 0.6591 0.7997 0.0779 0.4193 0.41
3 0.7518 0.9272 0.0684 0.3652 0.59
4 0.9370 1.1660 0.0550 0.2920 0.97
5 1.0350 1.2970 0.0499 0.2639 1.22
6 1.3320 1.6230 0.0379 0.2053 1.74
The results were put into the graph to show the strength of the earth´s gravitational field. These are shown in Graph one where the y axis is the acceleration, x axis is the
sin the intercept is (-F / m) and the gradient of the line on the graph is "g", the earth´s gravitational field strength. The line on the graph is not a line of best fit because all the results I obtained form a perfect positive correlation. I think is because I took three experiments at every height and then derived an average from the three which gave an accurate and reliable results.
Conclusion
I have concluded from my results that the gravitational field strength of the earth is 9.8 N/Kg. This is only accurate to two significant figures because of the limitations of quality and accuracy of the experiment. If I were to use more accurate equipment I would probably be able to show that the gravitational field strength of the earth is 9.81 N/Kg, though human error in implementation and calculation of the results.
Although I have not found g = 9.81 N/Kg, I have found that my results does fully support the result of g = 9.8 N/Kg. To find "g" I had to find the gradient of the line on the graph, the line on the graph was not a line of best fit, but a line which goes through all the points on the graph which means there are no odd results that may throw off the reading of g partially. There is a full positive correlation, which shows that the experiment was carried out accurately each time the experiment was done and a reading was taken.
My results show and prove that my prediction and scientific knowledge were accurate. I have proved Newton´s theories on gravity using a different experiment to the one he did. Newton´s experiment didn´t need many accurate measurements that required electronic measuring equipment. The strength of g may have been better measured using a simpler experiment that didn´t require machines to find measurements as this has less equipment to rely on and less factors that could go wrong. Newton using the pendulum found that g is 9.81 N/Kg so if I had to do the experiment again I would use the pendulum experiment.
As well as the gradient of the line being the gravitational strength, the intercept of the line is equal to the negative friction divided by the mass of trolley. As shown on the graph the intercept is -0.1. I can also conclude from my results that there are many uncontrollable factors that affect the experiment when trying to measure the earth´s gravitational field strength. Such as the variations that appear close to the earth´s surface, though these won´t affect Newton´s calculation when put to two significant figures. When measured to 3 significant figures we may not always get 9.81 N/Kg, but this is usually ignored because g is usually rounded down to one significant figure which is 10.00 N/Kg.
In my scientific knowledge it is stated that g is also the acceleration due to gravity so the calculation of g could be acquired simpler if I could measure an object in free-fall and then measure its time and displacement through the following derived equation
S = ut + ½ at^2 ,
Initial velocity is zero so, S = 0 + ½ gt^2
Therefore g = 2S / t^2.
Though for this to be accurate the only force acting on the object must be gravity and the air resistance must be negligible. The results also show that the force of gravity has not changed over time since Newton first carried out the experiments.
Evaluation
I believe that the experiment that I used to find the earth´s gravitational field strength was suitable and was able to accurately show "g". The measurements that needed to be taken were more complex such as the velocity, were measured by a CBL 2 data logger which is a hand held computer connected up to the light gate. There were no anomalous results as t reset the apparatus every time I did the experiment, this meant every time the experiment was done the apparatus was checked and re-adjusted.
This is important because when the height of elevation of one end of the runway was changed the light gate would have to be re-adjusted to make sure it was perpendicular with the picket fence on the trolley. There are limitations to the accuracy and results of my experiment because of certain factors to do with the apparatus and also fundamental factors that were uncontrollable.
One of these factors was the runway being curved due to its own weight, although not significantly causing an error in the results, it still does contribute to the overall result not being accurate to three significant. Another factor is the speed at which the trolley passes the light gate at as friction increases with speed. The light gate may not have been one hundred percent perpendicular to the picket fence causing a small in accuracy in the results. This is shown in Diagram 4.
The wheels on the trolley may have caused some runs to be slow and some to run normally which would severely affect the acceleration when calculated in the results. The measurements were accurately done though some ideas to improve them have come to mind, such as using a plumb line to measure the height of elevation of one end of the runway. This would mean the height is measured completely straight and accurately whereas I may have measured it at an angle which would cause the height to be measured greater than it really was.
The runway should have also been made of a stronger material that would not bend or curve affecting the run of the trolley. I did try to make the measuring as accurate as possible by using the CBL 2 data logger which was connected to the light gate to measure the time and velocity of the picket fence on the trolley, the distance between the start of the run and the light gate was kept constants the only factor that would affect the velocity of the trolley was the angle of the runway.
The light gate was put perpendicular to the picket fence each time the trolley did a run. To obtain fair and reliable results, I did the experiment at each runway angle three times and then took an average result and used it as my final result to be put into the graph. As the three results for each angle were extremely similar there were no odd results that would have thrown the average off. The angle of the runway was not measured using an angle measurer, instead I used trigonometry which meant the measurement of the angle was much more accurate as I only needed the measure the height of the elevated side of the runway and the length of the runway.
Overall I feel that the experiment was suitable as it did allow me to find "g" accurate to two significant figures so the limitations of the apparatus and error causing factors were not too great as the effect they had was minimal. If I had to do the experiment again I would use the trap door experiment as shown in Diagram 6. I would only need to find the displacement and time of an object in free-fall. This experiment would provide both and very accurately. The experiment would also be a lot simpler, I believe that the simpler the experiment the more accurate it will be and the lower the chance of human error.
The clock would measure the time and all I would have to do is measure the displacement and then putting these two measurements in the formula, g = 2S/t^2, would provide me with the earth´s gravitational field strength. I could also have used the original pendulum experiment that Isaac Newton used but I found that it would be even harder to measure than the original experiment, meaning it is likely to be very inaccurate when I try to calculate the results.
As my results came to g = 9.79 N/Kg, which is only off 0.02 N/Kg, I am sure that If I were to rectify the recognised causes of error I would easily get g = 9.81 N/kg. I also believe that the results were off because the trolley wasn´t in free-fall, it had a considerable amount of friction and air resistance acting against it. The steel ball from the trap door experiment would be in free-fall as there would be no friction acting against it and the air resistance would be a lot less than that acting on the trolley.
Potential & Kinetic Energy
SKILL AREA P: PLANNING EXPERIMENTAL PROCEDURES
Introduction
A trolley is pushed to the top of a ramp, the summit being 20cm from the ground, and then is released. It rolls all the way down the ramp, of 2 metres, before it collides with the wall at the bottom. A couple of keen scientists thought it would be interesting to record the time taken for the trolley to reach the bottom and then calculate its average speed. They let the trolley fall down the ramp two more times after that, just to make their results more accurate. They also wanted to investigate if the height of the summit made any difference to the average speed, so they raised the ramp to 30cm and pushed the trolley down the ramp again and recorded the time.
Basically I have been asked to act as the two enthusiastic experts and test, as a primary objective, to see if the height of the summit affects the average speed at which the trolley travels down the ramp.
Based on my existing scientific knowledge, I know that this experiment depends on a certain type of energy being converted into another type. When the trolley is raised to the top of the ramp, it gains a certain amount of potential energy - this is converted into kinetic (movement) energy as the trolley moves down the slope. Too see what factors may affect the way the experiment turns out, it may be useful to look at the formula for potential energy.
P.E = mhg (where m=mass, h=height and g=gravity)
Obviously, the more potential energy the trolley has got, the faster it will move down the ramp. So, theoretically, the only factors that can affect this experiment are the height and the mass and the gravity. Since we can only possibly conduct this experiment on Earth, the gravity will always stay constant - about 10m/s2 (or 9.82m/s2 to be more precise). The only factors left are the variables I will be experimenting with in this investigation
 Primary Experiment - I will be investigating, by varying the height the summit of the ramp is raised off the ground, if the average speed increases or decreases.
 Secondary Experiment - I will be investigating if the average speed changes by adding extra mass to the trolley.
There will always be smaller forces that could slightly affect the result, such as friction between the ramp and the trolley´s wheels, and air resistance. There is no way I can control any of these factors, but they shouldn´t affect the results so much as to give completely anomalous readings for each experiment.
Planning
When planning my experiment, I will need to take into consideration the following points:
 Safety
 Fair testing
 Equipment
 How many results I will take
 What range of variables I will experiment with
Safety
With this straightforward experiment there is not much that needs to be taken into consideration. No harmful substances are being used, neither are flames, solvents, atomic-reactors or insurance salesmen so all-in-all a relatively safe experiment. Obviously we will need to take precautions when increasing the mass of the trolley and make sure that all the weights are securely fixed to it by using sellotape, string etc. Especially when the trolley reaches high speeds, the likelihood of weights falling off is increased and this could be potentially harmful to an innocent on-looker. Also at the bottom of the ramp some sort of barrier will need to be placed to prevent damage to the trolley as it hurtles off the edge, or to thwart potential harm to any unsuspecting pedestrian/small animal. That´s basically it, the rest is all common sense.
Fair Testing
As with all scientific experiments, only one variable must be altered at one time. All the rest must remain constant to ensure good sensible results. By using present knowledge, I know that the following factors can affect the outcome and must be controlled:
 Height of ramp - as this is included in the formula for potential energy, the height of the ramp should affect the speed of the trolley in some way. I will be modulating this variable in the primary experiment, but it should be constrained to a single height in the secondary experiment.
 Mass of trolley - mass is also included in the formula for potential energy and so could affect the speed of the trolley one way or the other. As with height, this will be varied but only in the second experiment. With the primary experiment we should constrain it simply by not adding any weights to the trolley and always using the same trolley to collect each result.
 Gravity - the last portion of the formula for potential energy is gravity, which will affect the outcome if it is increased or decreased. The way to maintain this factor is to simply stay on the same planet.
 Friction - I mentioned that the only factors that should affect the outcome of the experiment would be mass, height and gravity - because they make up the formula for the potential energy. But other factors may use some of this energy when it is being converted into kinetic (movement) energy as the trolley moves down the ramp. The friction between the wheels of the trolley and the surface of the ramp can 'steal´ some of the energy used to move the trolley and convert it to heat instead. This can slow down the trolley, but only very slightly. To maintain the same friction for all the results we should use the same material for the surface of the ramp, and the same material for the wheel of the trolley. No grease should be added to lubricate any equipment.
 Air resistance - there is very little we can do to control this factor, and its effects would be so insignificant it may not matter. Basically, we just need to make sure we have the same trolley and we´ll have to mind we don´t accidentally attach a parachute to its back end.
 Water resistance - just to point out the obvious, it wouldn´t be recommended to conduct one experiment in air and one in water...water is far denser than air and will create a stronger atomic 'barrier´ which will drastically slow down the trolley.
With these points in mind it is essential that we must keep the same trolley, use the same ramp and keep the mass constant in the primary experiment; and the height constant in the secondary experiment. We will also have to keep the length of the runway the same, just so the trolley has enough time to accelerate.
Ranges and amounts
To make this investigation successful, we must choose a sensible range, and amount, of readings to record in order to come up with a useful and informative outcome. For example, in the primary experiment it would be pointless to experiment with heights ranging from 1cm-2cm because the speed difference would be minor. Instead a more sensible range, let´s say from 10cm-50cm, would be appropriate and should yield some interesting results. We could take readings every 10cm, and take a minimum of three readings on each height to work out an average (this makes the end result more accurate).
For the secondary experiment, I chose to be working with weight going up by 200g each time. Five or six is always a sensible number of results to obtain, so I will go up to about 1kg. Again, a minimum of three readings should be taken on each weight for a mean average to be taken. We may need to take results again if a factor that should be kept constant is accidentally changed, or if the trolley is knocked for example. On the other hand, it may be interesting to keep these anomalous results so they can be explained in the analysis. Below is a clear list of the ranges and amounts in my two experiments.
Primary Experiment-three tests on each 10cm)
20cm )
30cm > Keeping weight constant
40cm )
50cm )
Secondary Experiment-three tests on each 200g )
400g )
600g > Keeping height constant
800g )
1000g )
Equipment
Before we begin, we will need a list of equipment for the experiment to ensure it all runs smoothly:
Trolley - To roll down the ramp
Ramp - For the trolley to roll down
Metre Stick - To measure out 2 metres on the ramp
Chalk - To mark the start and finish lines
Stop Watch - To time the trolley
Barrier (bag) - To stop the trolley flying off the table
Books - For one side of the ramp to rest on, to increase the height of the ramp summit
Data Collection Sheet - To record our results on
Stationary - To write our results down with
Below is a diagram of how the equipment will be set up and used.
Using this equipment, we can easily obtain results with a high degree of accuracy. The usage of books means we can increase the height by any amount because some books are thicker than others are. We can get the height of the ramp at the start line almost exactly on the said measurement by simply moving the pile of books forwards or backwards fractionally. Perhaps manually timing the trolley with a stop-watch is not the most accurate way of recording the time taken, but we may find a better alternative when we come to the practical.
Why?
From this experiment I expect to find out what factors affect the speed of a body when no manual force is applied to them (i.e. pushing them). This experiment is being conducted to prove the potential and kinetic energy formulae which, once completed, can be used to calculate exactly the results of any situation using these theories. For example, the planning of a rollercoaster - if we prove the formulae, they can be applied to find the exact speed of the train at the bottom of a raised track x metres in height.
method
I have decided to produce a step-by-step guide for each experiment just to ensure that when we actually come to conducting the practical work, it runs flawlessly. This will also help us conduct fairer tests as we will be following the same set of steps each time we collect a result.
Primary Experiment
1. Set out equipment as shown in the diagram
2. Ensure the height at the start line (the summit of the ramp) is 10cm using the metre stick
3. Ensure there are no extra weights attached to the trolley
4. Hold the trolley with its front touching the start line
5. Simultaneously start the stop clock and release the trolley (be careful not to push it or exert any extra force on it)
6. Stop the clock when the front of the trolley reaches the finish line
7. Record the time taken for the trolley to reach the finish, next to the relevant height, in a table
8. Repeat from step 4 twice more so you end up with three results for the same height then continue onto step 9
9. Add all these results together and divide the answer by three to obtain the average.
10. Record this average in the table
11. By placing more books underneath the raised end of the ramp, increase the height at the summit by 10cm. Use the metre stick to check
12. Repeat from step 4 until you have obtained results for height from 10cm through to 50cm
Secondary Experiment
1. Set out equipment as shown in the diagram
2. Ensure the height at the start line (the summit of the ramp) is 10cm using the metre stick
3. Add 200g of weights onto the trolley and affix them securely with tape in the middle, so they do not interfere with the wheels.
4. Hold the trolley with its front touching the start line
5. Simultaneously start the stop clock and release the trolley (be careful not to push it or exert any extra force on it)
6. Stop the clock when the front of the trolley reaches the finish line
7. Record the time taken for the trolley to reach the finish, next to the relevant weight, in a table
8. Repeat from step 4 twice more so you end up with three results for the same height then continue onto step 9
9. Add all these results together and divide the answer by three to obtain the average.
10. Record this average in the table
11. Repeat from step 3 until you have results for weights 200g through to 1kg
By following these guidelines exactly, and not doing anything extra, we should conduct a very fair test.
Predictions
Primary Experiment
As I mentioned in the Introduction, the experiment is based on the potential energy at the top of the ramp being converted into kinetic energy at the bottom. I´ve taken this theory from the source book 'Physics For You´ (Keith Johnson) on page 115 where it simply explains the fact in a basic diagram of a diver climbing to the top of a board. He uses 6000j to climb the ladder so his potential energy at the top is 6000j. When he jumps off the board and falls, his potential energy is proportionally converted into kinetic energy. Halfway down, there is equal potential energy as kinetic (3000j each) and at the bottom all the potential energy has been converted into kinetic energy. Using this theory, we can say:
Potential Energy (at the top) = Kinetic Energy (at the bottom)
Page 118 and 119 of the same book explains how to calculate potential and kinetic energy:
"A weight lifter is lifting a mass of 200kg, up to a height of 2 metres. We have already seen how to calculate the potential energy of his weights:
Potential energy = work done
= weight x height lifted
But here on Earth, weight (in N) = mass x 10 so:
Gravitational P.E = Mass g height
(joules) (kg) (N/kg) (m)
(g has a different value on other planets)"
The book also tells me the formula for kinetic energy is:
K.E = ½ x mass x velocity squared
K.E = ½mv2
Knowing this we can write:
P.E = K.E
mgh = ½mv2
The formula can be simplified
20h = v2
SQRT(20h) = v
This formula will give us the average velocity for the trolley going down a ramp of h metres high. Once we have found this we can actually use the equation for average speed to find out how long it will take the trolley to reach the finish line and actually produce a theoretical result prior to conducting the experiment. Obviously, this won´t be necessary for a simple prediction, but it shows that the higher the ramp is raised, the higher the velocity of the trolley will be resulting in a quicker time to reach the finish line. I can also predict from this formuIa, the shape of the graph v against h. As h increases uniformly, by lets say 10cm each time, v will increase too - but not in proportion. This is due to the square root in the formula that we have to use to find v. The higher the height goes, the less gap there will be between the velocity of the present and previous heights. The graph will look something like this:
Therefore, I predict
Increase in height of ramp = Increase in velocity of trolley
Secondary Experiment
Again, for the secondary experiment, we just need to examine the equation that states potential energy at he top equals the kinetic energy at the bottom.
P.E = K.E
Mgh = K.E
Now looking at the equations at this stage, it seems sensible to say that a larger mass will result in more kinetic energy, and hence a faster velocity. But lets look at the formula for kinetic energy.
Mgh = ½mv2
Now we can see here that although a larger mass will indeed result in a larger amount of potential, and therefore kinetic, energy it will not result in higher velocity. BOTH sides of the equation contain mass, which simply means they cancel each other out.
Gh = ½v2
Therefore I predict that there will be no significant change in velocity when the weight of the trolley is altered.
SKILL AREA O : OBTAINING EVIDENCE
This section is mainly putting our planning into action, and hence is nearly all practical work so not much written work will be produced.
Primary Experiment
When we came to conduct our experiment, we decided to alter our plan and do two experiments. One using a stop-watch timer and one using a light gate to record the velocity of the trolley for more accuracy.
Manually timing the experiment:
Height of runway (cm) Time taken to travel 2m (sec) Velocity [distance/time] (m/s) Average speed (m/s)
10cm 3.42 3.58 3.39 0.58 0.56 0.59 0.58
20cm 2.23 2.15 2.09 0.9 0.93 0.9 0.91
30cm 1.81 1.75 1.64 1.11 1.14 1.22 1.17
40cm 1.39 1.52 1.37 1.43 1.32 1.46 1.41
50cm 1.24 1.25 1.28 1.61 1.6 1.56 1.59
Using a light gate and computer software:
Height of runway (cm) Speed (m/s) Average speed (m/s)
10cm 1.03 1.04 1.04 1.04
20cm 1.66 1.66 1.66 1.66
30cm 2.14 2.14 2.16 2.15
40cm 2.51 2.52 2.52 2.52
50cm 2.85 2.85 2.85 2.85
Secondary Experiment
As with the primary experiment, we used a light gate to collect another set of results.
Manually timing the experiment:
Added weight (g) Time taken to travel 2m (s) Velocity [distance/time] (m/s) Average speed (m/s)
0 3.51 3.44 3.32 0.64 0.58 0.61 0.61
200 2.33 2.17 2.13 0.86 0.92 0.94 0.91
400 2.26 2.15 2 0.88 0.93 1 0.94
600 2 2.15 2.16 1 0.93 0.93 0.95
800 2.1 2.21 2.21 0.95 0.95 0.9 0.94
1000 2.07 2.08 2.34 0.97 0.96 0.86 0.93
1200 2.2 2.31 2.29 0.91 0.87 0.87 0.89
Using a light gate and computer software:
Added weights (g) Speed (m/s) Average speed (m/s)
0 1.62 1.66 1.5 1.6
200 1.65 1.57 1.63 1.62
400 1.64 1.6 1.65 1.63
600 1.66 1.61 1.67 1.65
800 1.67 1.68 1.68 1.68
1000 1.68 1.69 1.7 1.69
1200 1.69 1.69 1.71 1.7
We repeated ALL results three times, even when using a light gate, to improve the accuracy of our experiment.
SKILL AREA A : ANALYSING EVIDENCE AND DRAWING CONCLUSIONS
Primary Experiment
The graph clearly shows the increase in speed as the height of the ramp greatens, but not in a proportional manner. The slight curve suggests that another force is acting on the trolley and not permitting it to increase speed uniformly.
Again, when using the light gate, the results clearly show that there is a definite increase in speed as the height of the ramp expands. The curve is slightly more prominent, and the peak speed reached in this part of the experiment is almost double of that in the last.
Conclusion
My prediction was proved correct as the graphs clearly show that the speed does indeed increase when the ramp is raised higher. This is due to the fact that more potential energy is given to the trolley as it is raised higher - height is part of the formula that makes up P.E:
P.E = mgh
P.E = mass x gravity x height
So the higher an object goes, the more gravitational potential energy it gains. When it falls, it´s potential energy is converted into kinetic energy and; since energy can neither be created or destroyed, only converted; it will move at a faster speed.
The vast difference in the manual timing speed and the light gate speed is probably due to reaction time. The computer is able to record the speed far more accurately than we can.
So, to sum up, as you lift an object to a height, the chemical energy stored in you (which comes from the food you eat) is converted into gravitational potential energy. Obviously, the higher you lift the object, the more energy you are using and therefore the more potential energy the object is gaining. Potential energy is converted into kinetic energy completely so the object when released will move at a faster rate depending on how high it is lifted.
Height does affect the speed at which a trolley travels down a ramp
The graph shows no pattern. The speed stays roughly around the 0.9m/s mark except for a suspected anomaly at the beginning.
The graph again shows no significant increase in speed as mass increases, but there is a slight increase nevertheless. It is again almost double the speeds recorded in the manual timing experiment.
Conclusion
The first graph shows a wavering line, going up and then down. This is expected from a manual timing experiment as results should vary depending on our reaction time. There is an anomalous result with no weights added - this was due to the fact that the trolley hit the side when travelling down the ramp, losing a lot of its energy on friction and a bit on sound which drastically slowed it down, as depicted in the graph. Other than this, the results tend to stay around the same speed.
The second graph does show a little, but definite, increase in speed. This is caused by the decrease in friction as more wheels are added. The extra force pushing down on the wheels made them less prone to losing their energy on the surface of the ramp - but this effect is only very slight. If we were to conduct this experiment in a place with no air resistance and no friction, we would see that the speed of the trolley stayed perfectly constant as mass plays no part in the equation of potential energy being converted into kinetic.
P.E = K.E
Mgh = ½mv2
Mass x gravity x height = ½ x mass x velocity2
Gravity x height = ½ x velocity2
Mass is cancelled out and theoretically has no impact on the speed of which an object travels when it is given gravitational potential energy. Galileo proved this with his famous experiment-
"...In the 17th Century, Galileo was the genius who looked at this phenomenon with fresh eyes. Legend has it that he climbed to the top of the leaning Tower of Pisa and dropped two cannon balls over the side. One cannon ball was heavier than the other was. Galileo´s professor was highly sceptical about Galileo´s idea and so Galileo had the professor lie at the bottom of the tower with his ear to the ground! This was so that the professor could listen out for the two thuds as one cannon ball hit the ground before the other one. The professor was dismayed to only hear one thud - they had hit the ground at the same time!.." Taken from Bev Aldridge´s PGCE Notes
You may say a feather drops slower than a cannon ball, but it only flutters to the ground because of air resistance. Air resistance acts on everything that moves through the air and is a force that opposes motion, i.e. it makes a moving body slow down. Some shapes result in less air resistance than others - a feather experiences much, and a coin very little. Thus when a coin and a feather are dropped from the same height in a vacuum, they both hit the ground at the same time.
This is an important principle in science. If air resistance is the same for two objects that are dropped, they will gain speed at the same rate as each other even if one is much heavier than the other is. So if they are dropped from the same height, they will hit the ground at the same time as each other.
This is expressed scientifically by saying that acceleration due to gravity on the earth´s surface is constant.
Mass has no effect on the speed at which a trolley travels down a ramp.
SKILL AREA E: EVALUATING EVIDENCE
The experiments went very well and ran efficiently, thanks to the plan we had drawn out beforehand. So well, we even had time to conduct another set of experiments using a light gate and a computer package. This extra equipment made us sure that our results were accurate and could be counted on. Thanks to the rapid speed of light, this device is extremely sensitive and can measure speed to a very fine degree. For our experiment, we didn´t require it to be as accurate as the system allowed so we rounded the results off to three significant figures. With our second set of results we were certain they were reliable and could be counted on. Unfortunately, the same couldn´t be said for the first set of experiments where we manually timed the time the trolley took to travel down the ramp. Due to human error and reaction time, these results could not be relied on completely, but did give us a rough idea. If we were to conduct the experiment again, I would save time by just producing results using the computer system with light gate.
There was one result that did not fit the pattern, and was too extreme to be our reaction time. This was the result for 0g on the manually timed weight experiment. It was suspiciously lower than the others were, and we agreed that it was the fact that the trolley hit the side wasting its energy on friction. When we noticed the trolley had hit the side, we decided to take the result anyway just to prove the point.
Thankfully, we had arranged to collect a sensible amount of results, which gave us enough information to draw a conclusion from. I would not choose to change the amounts if I conducted the experiment again because we managed to achieve maximum outcome in the time allotted.
If I were to do this experiment again, I would experiment with different surfaces of ramp. I wasn´t expecting the mass to have any difference on the speed but, even with the light gate, results showed a slight increase. I assume this was due to friction and would like to investigate its properties. Also I would use a trolley than travelled in a straight line! The main problem we found in our experiment was that the trolley kept swaying to the sides, creating a longer journey and most of the time hitting the edge. This wasted a lot of time as we had to conduct the result again. This also could have been due to uneven floor, so a spirit level may come in handy.
To extend this work, we could conduct Galileo type experiments, but take them a step further. Perhaps, if we had the access to the right equipment, we could drop weights from different heights in a vacuum (i.e. no air resistance), calculate the speed using light gates and see if it produces theoretically perfect results. We could also try eliminating any other opposing forces, such as friction, by polishing surfaces etc. and noticing if this changes the results.
To take the potential/kinetic energy element even further, we could look into elastic potential energy and see if it works on the same principle as gravitational potential energy. A simple experiment, such as pulling a trolley back against an elastic band and letting go to see how far it goes, or what speed it goes at would be of interest. And we could also look into what parameters effect the outcome, such as distance elastic is pulled, weight of trolley, type of surface etc.
All these things would help further our progress in this area of physics and help our understanding of the subject.
... e height doubles the potential energy doubles. The more potential energy an object has, the more kinetic energy it will have when it is released. The more kinetic energy an object has the more speed it has. There is a direct relationship between kinetic energy and speed. It is Kinetic Energy = 1/2 x Mass x Velocity2
In this equation if the speed doubles the kinetic energy quadruples.
Kinetic energy and Gravitational potential energy are equal:
Gravitational Potential Energy = Kinetic Energy
Mass x Gravity x Height = ½ x Mass x Velocity2
These two can be re arranged to give velocity:
Velocity2 = 2 x Gravity x Height
This means that I can estimate the velocity the ball will have before doing the experiment. This estimate may not be accurate because there are many other factors that affect the velocity of a ball but it does give me a general idea of what to expect.
Height of ramp in meters
Predicted speed in meters/second
0.05
1
0.10
1.4
(1.41423562)
0.15
1.7
(1.732050808)
0.20
2
0.25
2.2
(2.236067977)
0.30
2.4
(2.449489743)
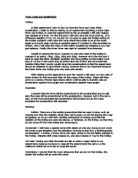
Before I planned this experiment I did some preliminary work and sorted out the heights I would use for the ramp. I didn't choose too many as I wouldn't have time to do all the tests but I needed a good number to see the effect of height of ramp on the speed of a ball. I also sorted out that I would use a runway of 1.5m. I chose this length as it will be long enough to give a good set of results and it should be easy to measure the time. If it was a very short ramp it would be very hard to measure the time a ball took to cross it, yet if it was a very long ramp it would give a more accurate time but would mean that the ball may slow down when crossing it so wouldn't give a very accurate result of the speed gained by rolling down the ramp.
I took some information for my plan out of 'Physics for you' by Keith Johnson.
Results
Height of ramp (cm)
Time (seconds)
Average time (seconds)
Average speed (m/s)
5 ...