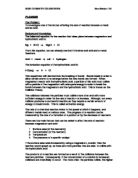
Diagram:
Apparatus:
- Burette
- Delivery tube
- Clamp stand
- Burette clamp
- Magnesium tape
- Distilled water
- Stop clock
- Conical flask
- Measuring cylinders (at least 2)
- Teat pipette (accuracy when measuring)
- Large water tub, containing water
- A flask of dilute hydrochloric acid
- Thermometer
- Ruler
- Pen and paper (to record results)
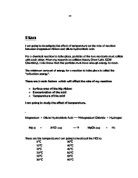
Prediction:
As the concentration increases, the rate of reaction will increase also. This is because the higher the concentration (of a reactant), the more particles there are. Consequently, there will be an increase in the number of collisions between the magnesium and hydrochloric acid particles. Using the Collision Theory, I predict that the increased concentration will provide more energy, and the particles will collide. Therefore, the rate of reaction is faster due to these collisions and if I double a certain molar, the rate of reaction will also double.
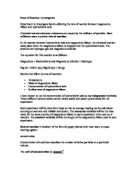
Key factors:
Key factor which I shall vary:
The key factor that I will vary will be the concentration. This is because it is the easiest to control concerning precision and reliability, as it does not constantly change like temperature.
Temperature is not as easy to control, because it regularly changes rather quickly. Also, because the actual reaction within the experiment gives out a temperature. I will not vary the surface area, as my school provides magnesium ribbons, rather than magnesium powder so it is more convenient. Finally, I will not vary the presence of a catalyst, as no catalyst is necessary in the reaction between magnesium and hydrochloric acid.
Ensuring precise and reliable evidence:
Greater precision means that my measurements are more detailed, and will enable me to produce more accurate diagrams such as graphs.
For example, I will record readings off the burette that are to 1 decimal place rather than a whole number. I will also use 2 separate measuring cylinders when measuring out the acid and water, so that the solution is as close to the molar as possible (e.g. 1.4M = 15cm³ H20 and 35cm³ HCl.) I will also read off the burette in the same way each time I record a measurement. This will be by measuring the bottom of the hibiscus of the water each time.
Preliminary work:
Before the final experiment, I have obtained 4 sets of preliminary results with a different molar and length of magnesium ribbon each time to help me decide which conditions in which my experiment will take place will be. I also decided to record my results to one decimal place, as I felt this was a reasonable amount to be able to draw sufficient graphs. Also, the burettes are quite difficult to read.
Here is a table of different molars:
To begin with, I used a solution of 1.8M with a 5cm magnesium ribbon I found that the reaction occurred too rapidly to have been able to record sufficient results. This encouraged us to lower the molar slightly and shorten the length of magnesium to 4cm and experiment with a 1.6M solution.
1.6M 4cm Mg
In contrast to this molar and length, I decided to experiment by lowering the molar and increasing the length once again to 5cm. Although, this particular experiment allowed me to take 8 readings.
1M 5cm Mg
The rate of reaction for this molar was still quite fast and I was only able to record 4 readings, so I decided to experiment an even lower molar, 0.4M and length, 3cm.
0.4M 3cm Mg
This enabled me to take even more readings than 0.6M, but I experimented further by increasing the molar slightly to 0.8M, with 3cm magnesium. Even though the reaction was fairly slow allowing me to take more accurate results, I felt that increasing the molar would not make a huge difference.
0.8M 3cm Mg
There was one implication that I noticed during my preliminary;
-The bubbles had not reached the top, so theoretically there is more hydrogen than the reading 50. I will ignore this, as it does not affect the rate of reaction overall.
OBTAINING EVIDENCE
Below are 3 repeats of a set of 10 results ranging from 0.4M TO 1.4M:
As written in my plan, I decided to use results that had 1 decimal place as I felt this was most appropriate. This is because the burette was quite hard to read, and I also felt that I would be able to produce a suitable graph.
I repeated each molar strength 3 times, as I considered it a reasonable amount to be able to produce more reliable averages. As a result of this, I will be able to analyse the investigation in an improved way.
From the results above, I have calculated the final averages:
As the results above do not represent the amount of hydrogen was produced, I will do the following calculation:
50 – amount of H20 = amount of hydrogen produced
Below, are the results of the amount of hydrogen produced:
Finally, from these results I have calculated the averages:
Using these results, I have drawn a simple scatter graph. There are no anomalous results, or outliers. Although, 1.2M has a steeper and higher best fit line than 1.4M.
ANALYSING
My first graph and set of tables show me that when I increase the volume of hydrochloric acid, there is also an increase in the rate of reaction.
This is because the ions are closer together in a more concentrated solution. The closer together they are, the more often the ions collide. The more often they collide, the higher the chance of a reaction between the magnesium and the hydrochloric acid. Also, because there are more particles in s highly concentrated solution, it is more likely that they would hit the magnesium so the reaction rate would increase.
If you increase the number of particles in the solution it is more likely that they will collide more often. In the reaction, when the magnesium contacted the acid, it fizzed and produced bubbles. The activation energy of a particle increases with heat, and the particles that have the activation energy are those particles, which are moving. In the case of magnesium and hydrochloric acid, it is the hydrochloric acid particles that have the activation energy because they are the particles that are moving and bombarding the magnesium particles to produce magnesium chloride.
Overall, I experimented 6 different molars of hydrochloric acid. The lowest molar concentration, 0.4M, produced the least amount of hydrogen. However, rather than 1.4M, which is the highest molar I tested, 1.2M produced the most hydrogen in 100 seconds (explained further in evaluation.)
With the help of this graph I drew another graph to see if I could prove my prediction further. I have estimated the rates of reaction (cm3 / sec.) with a gradient. I did this by finding the steepest part of the line between 2 points, and drawing a triangle (considering the line is straight.) I then did the following sum:
Vertical value – horizontal value = gradient = rate of reaction (cm3 / sec.)
Here are the following calculations:
Using these particular results, I have drawn another graph showing the relationship between concentration and rate of reaction.
From the results in the table and the graph we can see a steady increase in the rate of reaction as the concentration of the acid increases also (positive correlation best fit line.) This complies with my prediction. The graph shows that there is an increase in the rate of reaction as the concentration increases because the graph has it's largest gradient or it is steepest at this point. However, there are 2 anomalous results at the end that do not meet the best-fit line. This graph could be wrong because of inaccurate results. We can also see from the rate of reaction graph that when the concentration roughly doubles, the rate of the reaction does not double;
- 0.4M – 0.05 cm3 / sec.
0.8 M - 0.25 cm3 / sec.
- 0.6 M – 0.15 cm3 / sec.
1.2M – 1.70 cm3 / sec.
EVALUATION:
In my original prediction (planning), I predicted the following statement
‘As the concentration increases, the rate of reaction will increase also. Therefore, the rate of reaction is faster due to these collisions and if I double a certain molar, the rate of reaction will also double.’
According to my results and graphs, to a certain extent my prediction was correct. As the concentration increased, the rate of reaction also increased. The amount of hydrogen also increased. However, for 1.2M and 1.4M I experienced a few problems. They were anomalous results and did not fit the best-fit line. 1.2M also happened to produce a faster rate of reaction than 1.4M according to my results.
To ensure that my results were not even more inaccurate for the hydrogen produced, I have drawn on error bars for the first 2 concentrations (0.4M and 0.6M, see graph number 1.) For both molar strengths, at first the error bars are very close together, but as the time increases the error bars become further apart.
There are a few reasons why this may have occurred;
-I accidentally confused my results for 1.2M with 1.4M
-As I recorded my results for 0.4M to 1.0M in one week, and my results for 1.2 to 1.4M the process of the experiment may have differed slightly.
-Generally, the process may have changed, e.g. the bung may have been placed in the conical flask at different times.
-The ribbons of magnesium may have been slightly different lengths.
- When the reaction takes place bubbles of H2 are given off, which might stay around the magnesium, which therefore reduces the surface area of the magnesium and so the acid cannot react properly so this affects the results.
-The time in which I swirled the magnesium in the hydrochloric acid may have differed.
If I were to repeat the experiment I would make a few alterations to the process to ensure more accurate results. The first modification would be to take readings over a wider range. For example, I would use the range 0.0M to 2M. This would help me produce better graphs to analyse.
The second change would be to take 5 repeats rather than 3, as I feel it would also help me produce more accurate results. This is because if there were any irregular results that I had not noticed or had simply produced, the averages would not be affected as much.
I would also use a pencil to measure the magnesium ribbon, as I think that even the smallest difference in millimetres would make a variance.
Finally, I would measure the amount of time that I swirl the magnesium ribbon in the hydrochloric acid so that the results are fair each time.
If this process was carried out correctly, I predict the same statement as my original one. I would also predict that if the concentration was doubled, then the reaction rate would also double.