Prediction and Hypothesis
The prediction is going to be based on only one variable, which are the solute concentrations in the solutions. The surface area of the chips, the volume of the solution and its properties, the duration of the experiment and all the equipment used will be kept the same.
It is predicted that the chips in 0% solute concentration will gain in weight by roughly 10% - 15% estimated by comparing the two lines of best fit from the predicted graph and the pre-test graph. It is likely that they will gain in weight because as there is no solute dissolved in the water they will be placed in, the water potential outside of the chips will therefore be higher than the water potential inside of the chips which will be lower because the chips will definitely have some glucose (solute) in them as they were part of a respiring plant. Therefore, the solute will make the water potential within the chips lower than the outside of the chips so the water from outside should flow in to chips making them gain in mass. The chips should become turgid as the water flows into them by osmosis, the solute will not be able to flow in or out of the chip because the membrane is partially permeable which means it only allows water to flow through it and not other molecules such as glucose. A turgid cell will swell up as the water enters it because the increased turgor pressure in the vacuole will cause the cytoplasm to press against the cell wall and the flexible cellulose cell wall will bend and expand. When the cells are completely full of water like this, they are turgid and it is possible that if we left the cells in the 0% or even 5% solute concentrations for too long then they will swell up so much that the cell wall would buckle and the turgor pressure would cause the cells to explode.
It is predicted that the actual value at which the chips will on average neither gain nor lose weight when there is no net movement will be between the smaller values of 0% to 10% but excluding the two extremes. The reason the value could not be 0% has already been explained above yet, the reason it should not be 10% has been judged off the results of the preliminary test. The graph showed that between the values of 0% and 20% solute concentrations on the pre-test the change in mass had dropped severely from a 9.8% gain to a 40.6% reduction and at the value that would have been 10%solute concentration if it had been measured in the pre-test their would have been a 20% reduction in the mass of the chips. Therefore because the reduction was so low on the line of best fit at 10% solute concentration in the pre-test it would be silly to estimate that the value could be 10% inside the chips, so the predicted value will stand at 0% > value >10% (> meaning up to but not including the two numbers.)
After 10% solute concentration it is fair to say that the weight of the chip will definitely decrease as the solute concentrations from 10% upwards should be higher than the solute concentrations in the potato chips, evident from the pre-test graph and the predicted graph. The weight of the chips will decrease if the solute concentrations outside of the chips are higher than inside the chips because outside there will be a very low water potential due to the amount of solute and inside the chip the water potential will be higher as it has less solute within it. Osmosis will occur as always flowing down the water potential gradient so the water will diffuse from the high concentrations in the chips to the low concentrations outside of the chips in the solute solutions, the solute will again not diffuse out or in the chips because as explained before, the membrane is partially permeable and only allows the flow of water molecules. The cells in the chips, which will lose water by osmosis, will become flaccid, as the vacuole starts to shrink, they will become smaller and limp. If water loss continues rapidly which is likely with the chips in the highest solute concentration because they have an extremely low water potential, therefore will draw more water out of the chip, the cytoplasm will be pulled away from the cell wall due to a decrease in pressure and the cells will become plasmolysed. Again if the cells were left long enough in these high solute concentrated solutions, they would eventually break up or implode rather than explode.
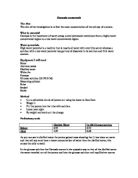
Predicted Graph
Apparatus List
To conduct the experiment you will need:
- 15 potato chips
- A water supply or large jug of water.
- 5 beakers.
- A bag of sugar
- A knife for cutting the chips.
- Paper towels for weighing the sugar and drying the chips.
- Labels or a sheet of paper with the solute concentration written on that the beakers can be stood on.
- A set of scales to weigh the sugar.
- A tile to cut the chips on.
- Equal lengths of red and blue string.
- Tweezers to remove the chips.
- A calculator to work out averages.
- A rough results tab le to record results.
Diagram
Plan
For the plan use the diagram and the apparatus list above
- Firstly, get 15 potato chips and cut them all to the same length about 4cms using a small knife, put them on a tile to cut them so that the wooden surfaces don’t get damaged.
- Fill the first beaker with 100ml of water; this is the 0%solute concentration so do not put in any sugar.
- For the next 5 beakers, measure the sugar in a paper towel on the scales so you don’t lose any. Follow this list:
5% Solute Concentration = 95ml water and 5g sugar
10% Solute Concentration = 90ml water and 10g sugar
15% Solute Concentration = 85ml water and 15g sugar
20% Solute Concentration = 80ml water and 20g sugar
- Cut 5 equal lengths of blue cotton and 5 equal lengths of red cotton.
- Separate the chips into 5 sets of 3 and within each three tie a piece of red cotton around one chip, a piece of blue cotton around another and leave one without any cotton.
- Once the cotton is attached firmly but not too tightly place all 5 sets of chips into the five beakers at the same time you may need about three people to do this.
- Make sure that in each container there are three chips, one with red cotton, blue cotton and no cotton.
- Place all the containers in their right places on the paper with the solute concentration so they can be easily distinguished or add labels to the beakers then leave for 24 hours.
- After roughly 24 hours remove each potato chip with the metal tweezers, weigh them on the scales and then record on a rough results table that can be copied up neater.
- From this table use a calculator to work out changes in mass, %changes and average %changes.
- Use the average %changes to plot a scatter graph with a line of best fit and then analyse the results.
Method
For the method the plan was followed exactly, it was decided that the beakers would be stood on a piece of paper with the % solute concentration written on rather than using labels because they were two small and fiddly, they also might have peeled off if any water had got on them.
Fair Test and Safety
To make the investigation fair many thing were taken into account, all weightings and measurements were take as accurately as possible and looked at by more than one person, the potato chips were cut so that they were all the same size as to not distort the results by having one with a large surface area that could absorb a lot more water than one with a smaller surface area or visa versa. The cotton was used because it is a good way of marking the chips without drastically reducing the surface area. The cotton was also all cut to the same length and not tied too tightly as it was difficult to remove when weighing the chips and we did not want to handle the chips too much in case they go squeezed and lost some water which would ruin the results. The solutions were stirred well so that the sugar would dissolve in the water and not just settle at the bottom. The intervals of the % solute variable were all even which meant it was much easier to measure and therefore fairer as less random errors would occur when measuring. Safety was not much of a hazard in this experiment because it did not involve hot or toxic materials, however, care was taken when using the knife, beakers and tweezers and a tile was used when cutting as to not damage the wooded desk.
Analysis
The graph shows a good negative correlation and all the results follow a basic trend near or close to the line of best fit. An average of all the results was calculated after the graph was drawn, it helps to support the graphs correlation as the average actually lies right on the line of best fit.
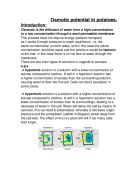
On the graph the point at which there is no net movement of water in or out of the chips is 6%; this result supports the prediction that was estimated at between 0% and 10% yet not the two extremes. The graph also helps to explain what is happening to the cells in solutions that are different from 6%. For example at 0% concentration the graph show that the chips gained in weight by an average of 10.4%, this means that water had entered the cells so their mass had increased. Water must have entered the cells because the solute concentrations in the chips were larger than the solute concentration outside of the chips. They would have had a lower water potential due to the fact that they had more solute in them so the water would flow by osmosis (diagram 1) down the water potential gradient and into the cells of the chips in this case. At 5% solute concentration the chips also gained in weight yet not as much as they did at 0%, they gained in weight for the same reasons as in the 0% solutions yet they did not gain by as much because the solute concentrations in both chip and solution were much more similar, meaning that the water potentials were also similar so there would be only slightly more water going into the plant as there would be coming out whereas at 0% solution there would be much more going into the chip than going out so its mass would increase by more. The cells in the chips that were put in solution lower than 6% would have become turgid (diagram 2) with the turgidity increasing the more dilute the solution because the more dilute the solution, the more water there would flow into the cell. The chips in the more dilute solution looked swollen because they had gained in water and there cells had become turgid, this means that the water had increased the turgor pressure in the vacuole causing the cytoplasm to push on the cell wall and made the cells expand, overall making the chips expand.
The graph shows that in 6% solute concentration the amount of water going into the cell compared to the amount coming out was even so there was no net movement and the mass of the chip stayed the same. This happens if the solute concentration inside and outside of the chips are the same, this would mean that the water potential would be even inside and outside the cell and there would be no water potential gradient for the water to flow down. Osmosis would still occur as the water particles move yet at any given time the amount of water going into the cell would be equal to the amount of water moving out of the cell so there would be no overall change in mass. The cells would stay normal size they would not become turgid or flaccid.
The graph also shows what happen to the chips in solutions higher than 6%, they were reduced in mass. This is because the solute concentration outside of the cells was higher than the solute concentration inside of the cells so inside the cells had a higher water potential gradient than outside the cells. As always the water flowed down the water potential gradient so there would be more water leaving the cell than there would be entering it, resulting in and overall reduction in the mass of the cell due to water loss. The cells in the chips that were in higher concentrations than 6% would have become flaccid (diagram 3) this means that as the water left the cell by osmosis the vacuole which holds the water shrinks as a response to the decrease in pressure. In the highest concentrations plasmolysis could have occurred in the cells, this happens when such a large quantity of water has left the cell by osmosis that the decrease in pressure is so great the vacuole shrinks even further and the cytoplasm starts to pull away from the cell wall.
The fact that it is winter may have had something to do with the rate at which the water molecules entered and left the cell and the results may have produced a much wider range if the temperatures were warmer. This is because as the temperature was quite low for the majority of the day and at night, osmosis would have occurred more slowly. This is because the water molecules will have less energy because they are colder as oppose to a hot molecule that moves a lot faster as it has much more energy. The water molecules in this experiment would have been quite cold so they would not have moved as quickly as ones with more energy meaning, that less pass through the cell membranes in the allotted time which was 24 hour. The amount of water in the chips in weaker solutions would have been decreased because the lack of energy in the molecules would mean that less were able to get into the chip in the time space, likewise, the water molecules in the chips that were in solutions above 6% would have been able to keep more molecules due to the lack of energy in the water as the water would have not been as fast at moving through the membranes and out of the cells.
From my results it could be theorised that plants in environments that are high in solute concentrations such as beach plants in sand that is high in salt may lose a lot of water by osmosis in their root structures as no doubt the outside environment would have a higher solute concentration than the inside of the plant therefore the water would pass out of the
plant into the environment by osmosis. These plants would have to adapt other ways to reduce losing water for example waxy leaves and stems, water storage bulbs in roots, curled or small leaves to reduce the surface area for transpiration, this may be the reason why plants found around or at the seaside are usually small brambles and ferns that are well adapted to reduce water loss. It may even be possible for some plants to produce large amounts of glucose or take up other solutes and salts through active transport so that they have a high solute concentration in their cells so that water will pass into them. Likewise the results can be used to theorise why marsh or pond plants have large, floppy leaves or smaller roots than usual. This is because the water in most pure ponds will have lower concentrations of solute than in the plant meaning that the water will flow into the plant at a steady rate. This is why pond plants are always turgid and have strong stems as their cells are full with water that helps to keep the plants rigidity. These plants have large leaves because they need to lose some water to stop their cells from exploding so larger and more leaves mean more water can be lost through transpiration out the stomata. They rarely have waxy coatings to reduce water loss and have increased surface areas for transpiration to take place. Pond plants usually have a long root for anchorage put the rest of the roots that come off that are quite small, this may be because they don’t want to take up too much water as it is readily available and they want to avoid the adverse effects of turgor pressure. Some plants may even be able to reduce the amount of glucose they make or even have less of a need for salts to try and decrease the gap between the large solute concentration they have and the weak concentration in the water so that less water would be taken up by osmosis and there would be a more equal stream going in as there would be going out, rather than just a lot of water moving in and little going out which may cause plants cells to explode under the turgor pressure.
Evaluation
Our method of the getting the results by doing an experiment in class was reliable, resulting in the investigation overall being a success. The results seem very reliable due to the fact there are few anomalies and any anomaly that there is has only a small difference between that and the line of best fit. None of the results except the average that was plotted later lie on the line of best fit, other lines of best fit could have been drawn which would make some results lie on the line yet it would make others much more anomalous, other lines were tested yet the line drawn on the graph was the one that I think best represented the data we had because when looking at the results table none of the results are particularly anomalous plus the fact that they fit the prediction so it seemed pointless to illustrate them in a way that made some look anomalous when they were all quite reliable and much to what was predicted.
The method used was efficient and this is likely because there was a pre-test in which to iron out any problem and make sure everyone knew the job they had to do in order to get the most reliable and fairest results possible. However errors inevitably occurred within the method and planning sections of the investigation some were systematic, due to the environment or equipment and couldn’t be helped whereas other were random due to human error and could have been helped with more care. The cuttings could have been cut more accurately to not only make sure that they were the same length but also exactly the same width and height to ensure that all their volumes would be the same and the surface areas that the water would be passing in and out of would be even as not to distort the results from chip to chip. Another problem with our plan might be that it wasn’t taken into consideration what part of the potato each chip was taken from some chips may have been take from the outside of the potato which may have cells of a larger volume in order to take in more water on the outside, this could have distorted the results if three chips that had cells with large volumes were put together in the 0% solute concentration resulting in a higher than expected gain in mass. Luckily, this did not happen and all the results seem to follow the negative trend well. To avoid it happening though all the chips should be taken from the same region in the potato so it might help if the chips were cut to a smaller size. The temperature might have caused a problem if some of the beakers were in hotter places than others such as nearer to a radiator because the water in those, which were in hotter places, would have had more energy meaning that the rate at which it moved through the cell membranes would have been quicker resulting in either more water going into the chips in the cases where it was in solute below the net value and more water going out of the chips were it was in solute concentration above the net value. To avoid this all the beakers need to be kept in a place with a constant temperature and not daily variations. They should also be kept away from heat sources unless the experiment is investigating them at hot temperatures. Another problem, which is a hazard with many scientific experiments, is the risk of contamination, some of the beakers may have glucose residue left on them from other groups doing the same experiment. This might cause a problem, for example, with the beaker that was supposed to have 0% solute concentration in the water, if it was contaminated with glucose it would mean the amount of water that would flow into the chips would be reduced because the solute concentrations would be more similar meaning that the water potentials of the two would be more similar and there would be
less of a gradient. This would affect the results because the mass of the chip at the end of the experiment would be less than what it should be in a normal 0% solute. This is likely to be the reason why our result for the 0% solute is the most anomalous one and the furthest away from the line of best fit. It is also below the line, which suggests that the chips did not take in as much water as they would be expected to do. Contamination again might have been the cause of the second most anomalous which is the one at 10% solute concentration. It lost 4% more water than expected and this could have been due to the fact that there was more solute in the water because of the contamination than what was actually put in causing more diversity in the amount of solute in the beaker and in the chips so consequently meaning that more water was drawn out of the chips than would have been if the amount of solute was accurate, which it wasn’t due to the contamination. To avoid contamination all equipment needs to be washed and dried thoroughly.
Other errors could have been the source of these problems such as simple random, human errors. If one of the chips was patted dry too much or even squeezed this could have had an impact of the results by making it look like the chip did not take in as much water as expected or lost more water than expected. It would have appeared the same on the graph as the contamination so we will never know which error or even error type is the cause of the anomalies.
However, whichever errors were the cause of any anomalies, they must have been only slight because the anomalies were only slight and overall the results were good enough to form a strong conclusion from and even feedback to predict from.
Many more experiment could be done to find out more about the task or further the results. For example the experiment could be done again but with a longer duration to see how the chips are affected over time and see how much wider the range of masses will go. It might even be possible to calculate a point of saturation when the cells can’t get any more turgid or when they even explode. Likewise the duration could be increased to see the point of implosion when the cells can’t get any more plasmolysed and they have lost all the water they contain and shrank due to a decrease in turgor pressure.
It would be helpful to do an experiment with the temperature of the water higher to see if this effects the change in mass at the solutes, maybe make more water enter with the dilute solutions and cause more to be lost in the strong solutions. It would also be interesting to see if water temperature has any affect on the % concentration when there is no net movement of water between the cells and the solution.
It would also be good to test the chips from different parts of the potato as they may have different solute concentration and it may be discovered that the point of no net movement will be different in different areas of the potato or even in different areas of the same chip. The smaller the potato slices from the different areas of the potato then the more detailed an analysis could be of which part of the potato has the highest/lowest % solute concentration.
The experiment could be done again using smaller concentrations, say with a range of 5%-7% and at intervals of 0.25% this way a figure for the actual % solute concentration in a potato chip could be pin-pointed to a much more exact figure.
Finally an experiment could be done using different types of potatoes to decipher whether the type of potato depends on the % solute concentration it has. The trends could be taken for many types of potato and then an average taken of them to give a figure which most represents the solute concentrations in many potatoes. This figure could then be compared or even investigated at the same time as an experiment to see if there were different solute concentrations in different parts of the potato and the links, if any, between them analysed.
By Charlotte Swain - 10 Separate Science