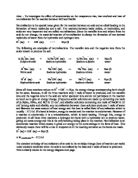
Alkali burette Acid burette adding 5cm3 at intervals. Solution gradually becomes colourless.
After this a graph showing the temperature and the volume of acid will have to be plotted:
Temperature
Temp.
Rise
25
Volume of acid
The formula for the heat evolved can be calculated using the graph above:
Heat evolved = mc ‘ ’, where ‘m’ is the mass, ‘c’ is the specific heat capacity and ‘’ is the temperature rise.
Hence, Heat evolved = mc ‘ ’
= 38 x 4.2 x
= ‘X’ Joules
To find out the value of the heat evolved, it is essential to know the number of moles present in each concentration being used, so the formula is used:
NaOH (0.8M)
n = CV
= 0.8 x 20/1000
= 0.016 moles
NaOH (1.2M)
n = CV
= 1.2 x 20/1000
= 0.024 moles
NaOH (1.6M)
n = CV
= 1.6 x 20/1000
= 0.032 moles
NaOH (2M)
n = CV
= 2 x 20/1000
= 0.04 moles
From the concentrations given we can see that the concentrations do not double or triple, in fact they get increased by a certain amount. This amount will be calculated in the Analysis section of the coursework.
The value for heat of neutralization = 54.6 kJ/mole. (I have taken this value from the GSCE book ‘Complete Chemistry’ by Rose Marie Gallagher and Paul Ingram)
Since the reaction is exothermic, the value for heat of neutralization would be –54.6 kJ/mole.
CONC 0.8M
NaOH + HCl → NaCl + H20
1 mole 1 mole 54600 J
0.016 mol 0.016 mol ? = 0.016 x 54600 = 873.6J
Heat evolved = mc
873.6 = (20 + 20) x 4.2 x
873.6 = 40 x 4.2 x
= 873.6 .
40 x 4.2
= 5.2oC
CONC 1.2M
NaOH + HCl → NaCl + H20
1 mole 1 mole 54600 J
0.024 mol 0.024 mol ? = 0.024 x 54600 = 1310.4J
Heat evolved = mc
1310.4 = (20 + 20) x 4.2 x
1310.4 = 40 x 4.2 x
= 1310.4 .
40 x 4.2
= 7.8oC
CONC 1.6M
NaOH + HCl → NaCl + H20
1 mole 1 mole 54600 J
0.032 mol 0.032 mol ? = 0.032 x 54600 = 1747.2J
Heat evolved = mc
1747.2 = (20 + 20) x 4.2 x
1747.2 = 40 x 4.2 x
= 1747.2 .
40 x 4.2
= 10.4oC
CONC 2M
NaOH + HCl → NaCl + H20
1 mole 1 mole 54600 J
0.04 mol 0.04 mol ? = 0.04 x 54600 = 2184J
Heat evolved = mc
2184 = (20 + 20) x 4.2 x
2184 = 40 x 4.2 x
= 2184 .
40 x 4.2
= 13oC
From the predicted values obtained for heat evolved we see that the temperature increases by 2.6 o Celsius when the concentration is increased.
Following is a table of the results that I expect to achieve:
Next I will illustrate the graphs that will be concluded from these values.
-
Temperature rise graph - I expect the graph for rise in temperature against concentration to be a Straight-line graph. This is because as the concentration of H+ and OH- ions increases the concentration of the H20 molecules produced would simultaneously also increase. Bonds will be formed and as a result the heat given off will also increase.
-
Heat evolved graph - I expect the graph for heat evolved against concentration to be a Straight-line graph. This is because as the concentration of H+ and OH- ions increases the concentration of the H20 molecules produced would also simultaneously increase. Therefore an increase in the number of bonds will be formed in the same proportion to the increase of H+ and OH- ions and hence, as a result the heat given off will increase.
-
Heat of neutralization graph - I expect the heat of neutralization graph against concentration to remain constant. This is because though the number of moles of acid increases I anticipate the heat that is given out when one mole of acid reacts with one mole of alkali to remain constant at the value around, 54.6KJ.
Temperature Heat
Rise Evolved
Concentration Concentration
Heat of
Neutralization 54.6kJ
Concentration
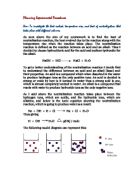
Prior Test:
List of Apparatus:
- 2 Burettes
- Clamp stand
- Plastic cup
- Thermometer
- 2 conical flasks
- Pen and paper
Materials used:
- Sodium hydroxide solution (1.2M)
- Hydrochloric Acid (1.2M)
- Tissue paper
After making my forecast on the results, I decided to carry out a prior test as explained in the procedure to see exactly how the experiment works. For the prior test, I used 1.2M acids and 1.2M alkalis. I put 20cm3 of the alkali into a plastic cup and added 20cm3 of the acid straight away. After measuring the temperature rise, I added another 20cm3 to check the fall in temperature. Following are my results:
NAME: ASHLEY FERNANDES
CLASS: SENIOR 5 ‘B’
CHEMISTRY ‘ENERGY CHANGES’ COURSEWORK
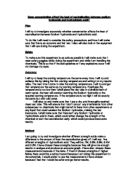
OBTAINING EVIDENCE
Following are the results obtained from the thermometric experiment that I had planned. This was the real experiment that was executed in the lab.
List of Apparatus:
- 2 Burettes
- Clamp stand
- Plastic cup
- Thermometer
- 2 conical flasks
- Pen and paper
Materials used:
- Sodium hydroxide solution (0.8M, 1.2M, 1.6M and 2M)
- Hydrochloric Acid (0.8M, 1.2M, 1.6M and 2M)
- Tissue paper
- Distilled water
The procedure was repeated again over here for all the concentrations of equal molarity of acid to equal molarity of alkali. The distilled water was used to rinse the plastic cup after each measurement and the experiment for each concentration was repeated twice in order to calculate and average value for analysis. Following are the results obtained from the experiments.
NaOH / HCL 0.8M
NaOH / HCL 1.2M
NaOH / HCL 1.6M
NaOH / HCL 2.0M
NAME: ASHLEY FERNANDES
CLASS: SENIOR 5 ‘B’
CHEMISTRY ‘ENERGY CHANGES’ COURSEWORK
ANALYSIS
In the introduction of the coursework, I had said that if the concentration is doubled or tripled, the temperature rise and heat evolved will also double or triple. This is because when the concentration doubles, there are double the number of hydroxide and hydrogen ions in solution and therefore double the amount of bonds will be made. And when double the amount of bonds are made, it means that the Temperature Rise and the Heat Evolved will also be doubled. But the Heat of Neutralization will remain the same since it is only the heat change when 1 mole of H+ ions is neutralized, producing one mole of water molecules. (Reference to the predicted graphs of the effects of Temperature Rise, Heat Evolved and Heat of Neutralization, on concentration again which I had predicted previously in the introduction)
Hence in order to test if my predictions are correct, I conducted an analysis on the readings and compared the different readings (Temperature Rise, Heat Evolved and Heat of Neutralisation), with the different concentrations (the whole section of Analysis). Below are tables in which I have calculated the average temperature of the two experiments, done for each concentration:
0.8M
1.2M
1.6M
2M
After obtaining the results, I decided to plot separate graphs for each of the concentrations to analyse them further, (refer to graphs drawn on squared paper).
(Graph 1 – 4)
Analysis and comparisons of graphs 1– 4:
- Observing the graphs, we see that after the point of neutralization, there is a straight line that goes diagonally towards the bottom right. Since the y-axis shows the temperature of the liquid in the cup, we can see that the temperature falls after the point of neutralization. The reason for this is that because when more and more acid is added, after neutralization has been reached, these hydrogen ions present in the extra amount of acid absorbs the heat, and as a result the temperature decreases.
-
From these graphs, we can also see that the volume of acid required for the neutralization wasn’t exactly 20cm3 as predicted, but it was 18.5cm3 in 1 case and 19cm3 in three case. This indicates that some of the heat may have been lost during the experiment as a result of the plastic cup being used for the reaction.
-
Observation of the graphs, illustrates that they are all straight-line graphs, which go slantwise towards the top right at the start. Since the Y-axis shows the temperature of the liquid in the cup, we can see that at first the temperature rises. The reason for this is that because when more and more acid is added, more and more hydrogen ions (H+) get into the cup and new bonds are formed. When these new bonds are formed, heat is given out, and so the temperature increases due to an exothermic reaction being favored, until it reaches the point of neutralization, which is around 20cm3 of acid.
0.8M x 1 = 0.8M
0.8M x 1.5 = 1.2M
0.8M x 2 = 1.6M
0.8M x 2.5 = 2M
From the above calculation we don’t see any doubling or tripling effect, instead we see the concentrations increase by 0.5M.
BARCHARTS:
Temperature rise/ Concentration:
(Refer to Graph 5)
Through the graph we see a definite connection between the concentration and the temperature rise.
To compare the results of the graph I decided to draw a table showing the predicted and the obtained values
Temperature Rise = Point of Neutralization – Initial Temperature
= 5.2°– 4.9°
= 0.3°C.
From the above results, I can conclude that the tests were satisfactory. Though there was no doubling and tripling due of the fact that there was no low concentration provided, for example 0.4M. Hence as a result, there was no doubling or tripling, but the values were increased by a factor of 1.5, 2, and 2.5 as we can see from the graph.
As the graph shows, we can also see that the points are, in general about the line of best fit, except for the last two values. From the graph we can also see how the predicted values are not really so different from the values that were eventually obtained, but the variation is, nonetheless, obvious.
There were actually many reasons for this, one possibility having been that the thermometer may not have been read inaccurately. This would obviously cause a great amount of difference to be present.
Heat Evolved/ Concentration:
(Refer to Graph 6)
Through the graph we observe a definite connection between the heat evolved and the concentration. Here as well, due to the fact that the lowest concentration provided was 0.8M and not 0.4M or lower. As a result, there was no doubling or tripling, but the values were increased by a factor of 1.5, 2, and 2.5 as we can see from the graph. To prove the correlation between the heat evolved and the concentration, I have drawn out a line graph showing the values that I had predicted when planning the experiment, along with another line showing the values that I had finally attained.
To compare the above results, I decided to draw a table showing the predicted and the obtained values
0.8M
Heat evolved = mc
= (20 + 20) x 4.2 x 4.9
= 40 x 4.2 x 4.9
= 823.2J
1.2M
Heat evolved = mc
= (20 + 20) x 4.2 x 7.55
= 40 x 4.2 x 7.55
= 1268.4J
1.6M
Heat evolved = mc
= (20 + 20) x 4.2 x 9.65
= 40 x 4.2 x 9.65
= 1621.2J
2M
Heat evolved = mc
= (20 + 20) x 4.2 x 12
= 40 x 4.2 x 12
= 2016J
From these results as well, I can again conclude that the tests were all right, because the difference isn’t a very large one, but the largest is simply a small value of 0.217kJ. As the graph shows, we can also see that the points are, in general about the line of best fit, except for the 0.8M and 2M concentrations. From the graph we can also see how the predicted values are not really so different from the values that were eventually obtained, but the variation is however obvious.
There were again many reasons for this, although the main reason was because of the fact that the head of the thermometer was somewhere at the bottom of the plastic cup when the acid was added. As a result, some of the heat may have been degenerated by the time it reached the thermometer, making the readings inaccurate.
Heat of Neutralization / Concentration:
Through this graph as well we see a definite connection between the heat evolved and the concentration. Here as well, because the lowest concentration provided was 0.8M and not 0.4M, or lower, there was no doubling or tripling effect, but the values were increased by a factor of 1.5, 2, and 2.5 as we can see from the graph.
To prove the correlation between the heat evolved and the concentration, I have drawn out a line graph showing the values that I had predicted when planning the experiment, along with another line showing the values that I had finally achieved:
To compare the above results, I decided to draw a table showing the predicted and the obtained results:
0.8M
Heat of neutralization = Heat evolved / Number of moles
= 823.2 / 0.016
= 51450J
1.2M
Heat of neutralization = Heat evolved / Number of moles
= 1268.4 / 0.024
= 52850J
1.6M
Heat of neutralization = Heat evolved / Number of moles
= 1621.2 / 0.032
= 50662.5J
2M
Heat of neutralization = Heat evolved / Number of moles
= 2016 / 0.04
= 50400J
From these results, I can conclude that the tests were acceptable, but not accurate enough, because the difference isn’t a very small one, as the largest difference is 5.85kJ for the experiment carried out for concentration 1.6M. As the graph shows, we can also see that the points are, in general about the line of best fit, except for the 1.6M and 2M concentrations. From the graph we can also see how the predicted values are not really so different from the values that were eventually obtained, but the variation is however obvious.
I conclude that the tests were precise at times, although it would have been much better if they had been more accurate over a longer phase of time.
NAME: ASHLEY FERNANDES
CLASS: SENIOR 5 ‘B’
CHEMISTRY ‘ENERGY CHANGES’ COURSEWORK
EVALUATION
Evaluation of procedure:
In the recollection of the procedure and the experiment done in the lab I found that, all the experiments for the four different concentrations were correct. All produced satisfactory values and when illustrated as a graph, produced a curve that looked suitable.
Problems encountered during the procedure:
- The air conditioner was on most of the time and this resulted in faulty readings when concerning the temperature notation at certain points of the experiments.
- The burette had a defective nozzle and this made the acid result in flowing out in drops. This wasted time and hence caused irregular reading due to improper time measurement. Hence errors were caused.
Sources of error in the experiment:
- The thermometer may have touched the bottom of the plastic cup instead of being suspended in the solution alone. Hence this resulted in an error in temperature readings.
-
The error of measuring the acid to exact 5cm3 was made as not all the time could the very exact same amount of acid that was measured before could have fallen into the plastic cup, also the lower meniscus might not have been taken into consideration when measuring the amount of acid.
-
Another mistake that I felt I must have been produced was that I might have taken the temperature readings from the thermometer too quickly, as soon as I added 5 cm3 of acid. Hence to get very accurate readings, I should have waited for a few seconds or so, in order to let the reactants react properly and the then read the thermometer. A stirrer could also have been used to mix the reactants in proportion as well.
Other possible precautions in the future:
The plastic cup should have been covered with a lid and a hole in it to fit the thermometer into. This would have drastically reduced the heat lost due to convection currents. This would have probably resulted in very accurate readings. The cup should have been insulated, put into another cup or maybe even made of another material such as polystyrene, in order to reduce the heat lost due to conduction. The following procedure to carry out the experiments is improved:
-
Measure out, and then fill 20 cm3 of alkali in the cup. Add 5 cm3 of acid and then measure the temperature.
-
Then throw out the solution, clean the cup dry and then add 10 cm3 of acid to 20 cm3 of alkali. Then note down the temperature.
-
After this again throw out the solution, clean the cup dry and continue in the same manner each time, adding 5 cm3 of acid.
This method would also produce excellent results. But to carry out this method is not suitable as it is a waste of acid, alkali and also of time. Another method to have very accurate results would be to make sure that the above precautions are taken and that the thermometer is replaced with a ‘Data logger’. This data logger automatically notes the temperature readings when called upon to, of a solution. This method however is quite expensive and is usually not carried out in a school laboratory and therefore it proves to be unnecessary.
With this coursework, I have hence achieved a good success rate since most of my predictions nearly match the obtained values and graphs.