As the Earth is much more massive than the asteroid the momentum conserved will change the Earth’s orbit very little and is of no concern – however the effect of the kinetic energy in this totally inelastic is not. As the collision is inelastic the asteroid will impact with the Earth and stay there. This collision will result in a huge amount of debris being thrown into the atmosphere, seismic shockwaves travelling through the Earth causing damages to structures and of course anything within the area of impact will be completely annihilated
The conservation of Kinetic energy law applies to this:
The kinetic energy will be split into: Heat
Sound
Light
Mechanical damage (work)
It is this mechanical damage that will cause the effects that I have listed above and could lead to the death of billions of people and animals.
I shall be dropping a steel ball into sand to simulate an asteroid collision, because the asteroid would be roughly spherical and have a high density, like the steel ball. The sand will react similarly to how the Earth would if impacted on.
I shall drop the ball from a range of heights from 20cm to 100cm in 10cm increments. I am going to do this many, as it is more than 8 measurements per experiment, which justifies me plotting a straight-line graph. This selection should also provide a visible trend in the results.
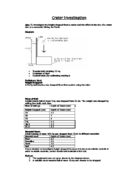
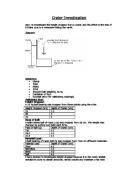
Method
This is how I shall complete the experiment:
One of two trays shall be filled with sand; this is where the ball shall be impacting. A metre ruler shall be held vertical touching the work surface by a clamp stand. The sand shall be shaken, and then the second tray pressed onto the surface to create a level area. A straw shall then be held on the surface of the stand and the right-angled setsquare shall be put level against the ruler and used to determine the height of the straw (cm). This shall provide a reference point to compare against after the ball is dropped.
The setsquare shall then be held square against the ruler at the required height for the drop. (The right-angled setsquare is being used to avoid parallax error in the measuring of the heights from the sand and the point the ball is being dropped from.)
The ball bearing shall be held level against the setsquare and dropped into the sand.
The straw shall be placed onto of the ball bearing and the height measured in the same way as before.
Then the height before the drop (A) shall be minused from the height after the drop (B). This shall equal the amount of the ball bearing above the surface of the sand (C). This shall be minused from the diameter of the ball bearing (2) and equal the depth of the crater.
B - A = C
2 – C = Depth of crater
The sand shall then be levelled again using the previous technique and the experiment repeated three times from each height.
See attached diagram of method.
Diagram of equipment
Equipment
Clamp stand,
Sand,
2 circular trays,
2cm diameter steel ball bearing (mass 28.08g),
Plastic straw (20cm long),
Right-angled set square,
Metre ruler
Fair Test
Factors that can affect the experiment:
Height ball is dropped from,
Mass of ball,
Diameter of ball,
Amount of sand,
Density of sand,
Velocity of ball
The only factor that I shall be changing is the height the ball is dropped from (this causes the velocity and as such does not interfere with it). I shall be using the same ball bearing for all of the tests and the same apparatus will be used. The same person shall also take the measurements. The sand shall be levelled and measured before each drop and the height measured again afterwards without the ball or sand being moved. The experiment shall be repeated three times for each height so the results can be averaged and the effect of any odd results can be minimised. I have chosen this number of repeats because it is enough to minimise odd result effects and does not take an incredible amount of time to do. The right-angled setsquare is being used to avoid parallax error in the measuring of the heights from the sand and the point the ball is being dropped from.
Preliminary Experiment
For my preliminary test I only did the experiment over a limited number of heights in my planned range, as I just wanted to gauge if the experiment appears to be successful. If the results had been wildly different to what I had expected, (a steady increase in the depth of the crater the higher the ball is dropped from) I would have to have changed the experiment. With one exception, it appeared to work, here are the results I collected:
The one exception was the drop from 40cm, I do not know why this result didn’t fit in with the trend, and hopefully by conducting the experiment multiple times, the effects odd results like this have on the averages can be minimised.
Prediction
I predict that the higher the ball is dropped from, the deeper the crater shall be because the velocity of the ball, and thus its momentum will be greater, the higher its start position is.
Kinetic Energy = ½mv2
Gravitational Potential Energy = mgh
Where mass is in Kg and height in metres.
Potential energy may be converted into energy of motion, called kinetic energy, e.g. the water behind a dam has potential energy, when this is allowed to flow it converts to kinetic, but some is lost through heat and noise.
An object dropped from rest will increase its speed until it reaches terminal velocity due to the force of gravity acting on it. This is why the ball shall have a greater velocity the higher it is dropped from, because it has more time to accelerate.
The formula for calculating velocity is: Velocity = √ (20 x Height)
I believe that may average result graph shall look something like this judging by the results I collected during my preliminary experiment and the fact that the height of release is proportional to the depth of the crater so the graph should conform to Y = mx + c. Hopefully it shall produce a straight-line graph, as the depth should be directly proportional to the height.
Results Table
Experiment 1
Experiment 2
Experiment 3
Averages
Conclusions
The trend evident in my results and graph is that the greater the height the ball is dropped from, the deeper the resulting crater shall be. The results plotted on the graph form an obvious line that shows this trend, though it would appear that my results weren’t accurate enough to get a straight-line graph; as a number of consecutive increments generated the same results.
I used a number of formulae to work out the maximum potential energy in the system, the maximum kinetic energy in the system and the velocity that the ball bearing would have had on impact with the sand. I collected this evidence to help either support or disprove my prediction.
My line of best fit shows the how close my results were to being a straight line graph as it passes very close to all of them. The straight-line trend shows that the height of drop and the depth of the crater are proportional to each other.
The proximity of the results that I collected, to what I predicted would happen, shows that the evidence that I based my prediction on was correct. My results graph is also almost identical to my prediction graph, again backing up the facts that I based my prediction on. In all my results provide a lot of support for my original prediction.
Evaluation
In all there are a number of aspects of the experiment I would change and/or improve on if it were repeated.
I would use larger increments between the drops to try to achieve a better straight-line graph showing proportionality. Having this would fit in with the calculations and information I based my prediction on.
I would make it a fairer test by having the same level of sand every time the ball was dropped, as different depths allowed for different amounts of compression so could have influenced my results. On the same note I would also have used a deeper depth of sand, so the effects of the ball could be seen more easily.
The use of more accurate measuring techniques would also have improved the experiment e.g. measuring equipment which uses laser beams to register measurements to a high degree of accuracy, but for the situation I was conducting the experiment this would have been impractical.
Collecting more results will always improve the accuracy of the experiment; it would also help more with minimising the affect odd results had on my averages and subsequent graph. As to the odd results that occurred, I am not sure what caused them, as there are a number of small factors that could have affected the drop. The fact that the height of the setsquare was judged by eye decreases the accuracy of the measurements taken.
I believe that the experiment I conducted could be used to predict the outcome of a 500m radius asteroid hitting central Australia at 4000m/s with some degree of accuracy.