Surface area of pendulum A larger surface area perpendicular to the motion of the system would cause more energy to be lost because there would be more air resistance.
Friction Primarily at the pivot point, friction will cause potential energy to be lost as heat.
For this investigation I will choose to vary the surface area of pendulum as I feel it will give a good opportunity to take a good range of results and should be the easiest to implement. All other factors however will have to be kept constant.
Practical Procedure
I am going to record damping as the amount of time taken for the amplitude of the oscillations of the pendulum to reach ½ the initial amplitude of the system. This is because the time for the oscillations to be damped down to nothing is impractically large and times for ½Ao are large enough to avoid significant % error in time recording equipment.
I previously concluded that the effective length of the pendulum and the mass attached to the pendulum would have to be kept constant so I performed some preliminary investigation to determine what values I should use.
Effective length of pendulum
Mass on end of pendulum
(Effective length = 0.80m)
(Using mass of 0.200kg)
I decided to choose effective length of 0.80m and a mass of 0.200kg. This is because they gave the longest times for ½Ao and – especially bearing in mind the times should be shorter once the surface area is increased – I want to try to minimise % error in the stopwatch. The mass can be attached to the pendulum using 2 elastic bands.
I also decided that friction at the pivot of the system would have an effect on the damping. I should aim to reduce this factor as much as possible as it will inevitably create errors in my readings. I found during my preliminary experimentation that placing a washer between the pivot and the clamp did help reduce the friction but I obviously will never totally decrease the friction to nothing.
Another factor I need to consider is the position of the card on the ruler. Firstly I decided to attach one piece of card to just one side of the ruler. Although only the leading edge of the pendulum has any significant effect on the damping of the pendulum, to keep the test simple (so as not to bring any other variables into consideration) I felt it best to just use one card.
I then performed some preliminary investigation to decided how far up the ruler the card should be attached.
Effective length = 0.80m Mass = 0.200kg
Surface area of card = 0.21m2
The distance up the ruler had surprisingly little effect on the damping but seen as attaching the card 0.20m above the mass had the greatest effect I will use that figure in my experiment.
After trying a number of different methods I decided the simplest way to measure the amplitude of the oscillations was to measure it linearly along the horizontal. Probably the most correct method would be to measure the displacement along the curve of the oscillations but this would be much more difficult thus increasing the chance of human error.
I found that when the system oscillated the stand had a tendency to ‘wobble’ and sometimes even collapse completely. To overcome this I placed some heavy masses on the bottom of the stand (3kg in this case) to stabilise the system. This did work at smaller amplitudes but at larger values for Ao (>0.30m) the system was still disrupted.
To measure the amplitudes I decided to attach thin pieces of coloured card to the table using blue tack at the points A=0, ½Ao and Ao, then as long as I stand exactly in line with the points I should be able to see when the amplitude drops below ½Ao. A problem with this method will be that although I will be able to get the time of the first oscillation that occurs with an amplitude < ½Ao, I won’t be able to define the exact moment when the amplitude of the system drops to ½Ao but hopefully this won’t have any significant effects on my readings.
During my preliminary investigation I decided that 0.30m along the table was a suitable value for Ao giving me 0.15m for ½Ao. I decided upon this value because I wanted to try and use the largest oscillations I could without the forces involved been to large for the system to cope with.
My pivot was made by putting a nail through the ruler and clamping the nail between two pieces of wood. This worked quite well (especially with the washer reducing friction) but the nail created a safety issue. To overcome this I decided it was best to place a piece of blue tack over the sharp end of the nail especially considering I found the system to be rather unstable at larger amplitudes.
I aim to take readings at 6 different surface areas. Keeping the width of the cards constant (0.07m) I will take readings at intervals of 0.05m along the length of the card starting with a card of surface area of 0.021m2 (length 0.3m). I will aim to repeat each reading 3 times for accuracy.
Apparatus
2 x 1m rulers (accurate to ±0.001m)
Stopwatch (accurate to ±0.001s)
2 x 0.100kg masses (assumed to be precisely measured)
2 x elastic bands
6 pieces of card of width 0.07m and lengths at 0.05m intervals (0.30m to 0.05m)
A stand + clamp (3x1kg masses to stabilise)
Thin strips of coloured card (x3)
Two small pieces of wood and a nail
Blue tack
Method
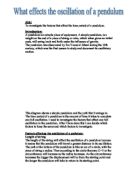
- Set up equipment as shown in above diagram.
-
Attach centre of card surface area 0.021m2 (length 0.30m) 0.2m above the mass.
-
Making sure to stand completely in line with the point, pull the ruler up to Ao (A=0.30m) (so as the ruler is covering the coloured card at that point)
- Release the pendulum to begin oscillations, simultaneously starting the stopwatch
-
Position yourself perfectly in line with the point ½Ao (A=0.15m) and wait until the moment the ruler (at its maximum amplitude) covers the piece of coloured card at ½Ao, stopping the stopwatch when it does.
- Repeat the readings a further 2 times and then repeat the same process for card of length 0.25m 0.20m etc… down to 0.05m
Predictions
I think that as the surface area of card attached to the pendulum increases, the force of damping will increase thus the time for ½Ao will decrease. We can say the time is inversely proportional to the surface area (T ∝ 1/A).
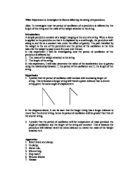
The relationship will most probably not be linear. At first when the system is moving quickly there will be a lot of air resistance to overcome so energy will lost quickly. As the system slows down there will be less air resistance so energy will be lost at a slower rate as shown in the graph below.
The relationship will be in the form T = kAn where T is the time taken for ½Ao, A is the surface area of card attached to the pendulum and k and n are constants (n should work out to be a negative number to represent the inverse proportionality).
To find values for k and n I will need to plot a straight line graph and compare my relationship to the equation y = mx + c. To do this I will have to take logs of the equation T = kAn so as to turn the power n into a coefficient of A.
So T = kAn becomes logT = nlogA + logk which compares very easily to the equation for a straight line;
y = m x + c
logT = n logA + logk
This shows that if I plot logT on the y axis and logA on the x axis, I should get a straight line with gradient n intercepting the y axis at logk.
Results