These are results of our preliminary test
From these results we decided that 500mm was the optimum length of the cantilever.
Method
Our equipment for the investigation will be:
- A wooden metre ruler-the cantilever
- A G Cramp to secure the cantilever to the lab bench
- A second meter ruler to measure the deflection of the cantilever
- 5x100g weights
- A mirror and pin
- We shall use mass’ of 100-500g at 100g intervals
G-Cramp Cantilever Pin Mirror Ruler
We are going to fix the cantilever to the lab bench at a length of 500mm using the cramp. The pin will be fixed to the end of the cantilever so as to give accuracy in the taking of the results. We will obtain our measurements by lining the pin up with it’s image in the mirror to ensure that we are taking the result at eyelevel, and record the distance between the end of the pin to the floor. The mirror is used to ensure accuracy in the experiment because the person recording the results is perfectly level with the measurement. I will take readings at 5 different masses 3 times per mass and work an average from the 3. This ensures that the final measurement is accurate. The readings will be taken at 100g, 200g, 300g, 400g, and 500g. We will make the test a fair test by making sure that the aspects of the test are non-variable such as the length of the cantilever and the we use the mirror every time to read the measurement.
Prediction
I think that as the mass of the load increases the deflection of the cantilever will increase proportionally.
I think that this will happen because as the compressional and tensional forces (which support the weight of the cantilevers load) increase the cantilever deflects.
Analysis
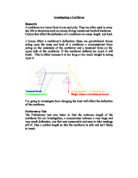
The graph shows that the deflection of a cantilever is directly proportional to the mass that supports it. The increased forces of compression and tension cause the increase in deflection, which counter the force of weight; therefore the line of best fit is a straight line. Furthermore the line of best fit passes through the point (0,0). This is because there is no weight to be countered by the compressional and tensional forces, no deflection is caused as a result of this. The graph should continue as a straight line until the weight exceeded the maximum amount of force that can be exerted by the cantilever, at this point the cantilever would break.
Evaluation
My prediction was correct because as the mass increased so did the deflection proportionally. I think that our experiment went very well. Our results were measured accurately and the correct practice was followed throughout. I had slight difficulty taking readings because of the steadiness of my hand but we hardly found this a major difficulty. We got a couple of odd results, which I have circled and highlighted on the graph. The odd results came from things such as a member of our group knocking the pin as they took the load on and off or the steadiness off my hand. To prevent this from happening we could have attached the pin to the cantilever more efficiently, it could have been tied on with string. Also a different member of the group could have taken the results, a member with a steadier hand. Ways that you could improve the experiment are you could tie the pin on with string to avoid knocking it. You could also, with a clamp and a stand make sure that the ruler was always at a 90° to the floor and that it was always in exactly the same place. You could make the results more accurate by taking 5 readings instead of 3 per weight and take an average from that. I would extend the experiment by changing the material of the cantilever to plastic, metal or a different type of wood. I would also try taking readings at 10g intervals instead of 100g.