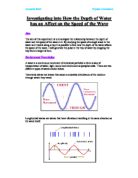
I also predict that my graph will be a curve. I predicted that the greater the depth the faster the wave will travel, however at a certain depth the wave will reach an optimum speed that it will not be able to exceed hence the graph will be in the shape of a curve. The reason that the speed of the wave will reach an optimum is because the water will come to a depth where there is enough water for it not to interact with the bottom of the tray and there will then be no reason for the speed to increase. Below is a graph to show how I think my results will be illustrated on a graph.
Variables
As always, there are variables that can affect our results. I will have to keep changing one of the variables hence its name: the independent variable. All the other variables will have to be kept constant. These include the length of the tray, the surface area of the tray, the viscosity of the liquid, the height from which the tray is dropped, the amount of times the wave goes backwards and forwards.
The independent variable in this experiment will be the depth of the water. I found out that 1200ml would give a depth of 1cm and so I decided that I would increase the depth by 500ml increasing the depth by 0.4cm each time. I hope to get at least five readings so that I can makes some suitable conclusions to my investigation.
My dependent variable will obviously be the speed of the wave. This is because in this experiment I want to study the relationship between depth and speed and the speed will only change as I change the depth.
The length and the surface area of the tray will also have to be kept constant. Firstly, this means not changing the tray used with a new one! To make sure that the surface area is the same for each experiment I will take a measurement of the depth of the water five times in each separate experiment. I will then take an average to make sure that the surface area is constant. I will note this down to be the depth. However, I have calculated that the average depths should be as follows: 0cm, 0.4cm, 0.8cm etc. If it is not I will note down the correct depth.
The viscosity of the liquid is an important variable. The less runny the liquid the more slowly the particles will move up and down thus the wave will become slower. In this experiment the same liquid will be used for each separate experiment. This liquid will be water and therefore it is not likely that the range of viscosity will be large enough to significantly affect the velocity of the wave.
The height that I drop the tray must be kept constant, as a greater height would mean a bigger force, which would mean that there would be a bigger acceleration and speed. This is illustrated by the equation:
I have decided to drop the tray from a height of 5cm as it will make a good starting push and will create a noticeable wave. It will also not splash any water out of the tray!
Lastly, the amount of times that the waves move backwards and forwards must be kept constant. This is because as the wave continues to reflect itself the force acting upon the wave weakens and the speed of the wave decreases. Thus if the wave is left to travel a very large distance then the speed of the wave may not be constant, making my results irrelevant. I decided that I would let the wav move back and forth 3 times.
Risk Assessment and Precision
For precision I will have three readings for each particular experiment and then find an average measurement, which will be plotted on the graph and will be analysed.
I will vary the water depth at least five times with an increasing interval of 0.4cm. If I have time to take more readings at other depths I will but I have to makes sure that I have at least five so I can make suitable conclusions.
I will also take my reaction time, so any anomalous data can be explained. I will take my reaction time by starting the stopwatch and then immediately stopping it as fast as I can. I will do this three times and then find an average for my reaction time. I will do this to make sure my reaction time is accurate.
There is only one safety measure to take in this experiment, as we are not dealing with dangerous objects such as glass or acidic chemicals! This safety precaution is if by accident there is a water spillage, a “slip hazard”, one should immediately get some tissues and mop it up until it is safe to carry on with the experiment.
Apparatus
Below is a list of apparatus that will be needed to carry out the experiment:
- A plastic tray
- A small ruler (measuring centimetres)
- A metre ruler (measuring in millimetres)
- A beaker (measuring 500ml)
- A stopwatch
- A piece of paper (with a table to write down your results)
- A pen
- The plastic tray will be used as a container for the water.
- A small ruler will be used to measure the height at which the tray will be dropped (in our case it will be 5cm)
- A metre ruler to measure the depth of the water and to make sure the surface area is equal.
- A beaker will be used to add 500ml to the tray to increase the depth by 0.4cm.
- A stopwatch will be used as an instrument to time the speed of the wave.
- A piece of paper and pen will be used to record the results.
Method
- Set up all the apparatus on the laboratory bench. Make sure that you have a piece of paper (with a table to record your results) and a pen.
- Fill the beaker with 500ml and empty this into the tray.
- With the metre ruler at five different places in the tray measure the depth and find an average. This should be approximately 0.4cm for every 500ml.
- Write down this average depth in the depth column on your results table.
- Now measure the length of the tray with the metre ruler. Multiply this by three and write down the value under the distance column.
- Measure your reaction time using the stopwatch by quickly starting and stopping the stopwatch. As said before do this three times and then find an average, making this you reaction time.
- By now the water in the tray must be relatively still. Measure with your small ruler 5cm upright.
- Lift the tray to the 5cm height you have measured with the ruler.
- Again wait for the water in the tray to become moderately still.
- Now drop the tray and start the stopwatch as it hits the surface of the laboratory bench.
- Watch the wave move backwards and forwards three times and stop the stopwatch as soon as it hits one of the ends for the third time.
- Record the result and repeat the experiment three times for each depth.
- Below is a table for each of the other depths.