There are other variable which affect this experiment, e.g. pressure, but I have listed and explained the main ones.
4) The variable I have chosen and why:
The variable I have chosen is concentration because it is clear to distinguish that it is the easiest to control and that suppose if too much acid is put in, we can to dilute it to the concentration needed.
* How I will ensure that my experiment shall be a fair test:
I am going to change only ONE variable and will make sure that all the other variables will be kept constant.
5) The range of this variable I am going to use, and the number of values: I will be using a small range of 5 different concentration levels; 0.8M (40%), 0.9M (45%), 1.0M (50%), 1.1M (55%) & 1.2M (60%) of acid. I decided to use a smaller range because I thought this would give me a much more concise view of the small changes in concentration and how even the smallest changed of 0.1M of HCl can produce significantly different results.
6) How I am going to control the other variables:
Surface Area: Magnesium – I will use same length from the same roll and that the length/width is constant and that it is cut by me.
Temperature: I will be using it in a water bath which will contain cold water (constant temperature being estimated at 20°). I will also consider using a thermometer to compare the start and end temperature of the reaction.
Light intensity – the experiment shall be conducted away from windows and will be done in the same position of the room for all five experiments.
Catalyst: This issue does not concern me (either the catalyst is there or not).
Stirring/Shaking: I AM NOT GOING TO SHAKE OR STIR. I don’t think I will produce fair results as it will be difficult to correctly stir/shake the solution and record the rate of the reaction at the same time.
Acid: I will be using the same bottle of acid each time as other bottles of HCl could possible be contaminated an I must ensure that the exact state of the HCl is the same each time I use it.
- I won’t control pressure as it is harder to maintain.
7) What I expect to happen to the rate when I change the variable:
When I change the variable, I expect to see an increase in the rate of gas being produced per second when I increase the concentration of HCl, and vice versa if I use a lower concentration, as there will be less acid to react with the magnesium, so the rate will decrease as less gas is being produced per unit time. I am predicting that if I double the concentration, then the rate should also double because we are also doubling the chances of successful collisions happening per second;
e.g. 100 collisions, 5% have energy greater than activation energy.
Doubling = 200 collisions, 10% have energy greater than activation energy, so we should expect a directly proportional result.
8) An explanation of why I expect this behaviour: This is because reactions can only occur if collisions between reactants occur. Increasing the concentration of a reactant increases the chances of a collision and therefore there are more collisions per second. Of these collisions, more will occur with energy greater than the “activation energy” (the minimum energy for a reactive collision), and ultimately the rate of the reaction increases. We should see a reduction in rate if we use more water because by diluting the acid it reduces the number of HCl particles, therefore there would be less number of HCl particles colliding with Mg particles so there would be less successful collisions, causing a reduction in the rate of reaction. And this causes a reduction in the amount of hydrogen gas being produced because if we dilute the acid with water then there would be less HCl to react with the Mg, so there won’t be enough HCl to react with all of the Mg, therefore less gas is given off.
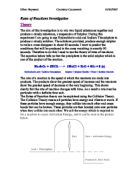
9) Exactly what experiment I plan to do, with apparatus, volumes of acid and water, length of Mg, and measurements to be taken:
Firstly the following apparatus should be collected:
- Gas syringe
- Conical flask
- Bench mat
- Stand with clamps
- 2 x measuring cylinders
- 2 x burette tubes
- Water trough
- Thermometer
- Rubber bung
- Stop clock
- 2 x beakers
Method: Set up apparatus as it is shown above. Length of Mg: equally cut into length 5cm and folded in half twice. Place a 5cm sample of magnesium ribbon into the conical flask and pour the required amount of water in it. Measure out the required amount of 2M hydrochloric acid and then quickly pour it into the conical flask. Immediately connect the gas syringe with the neck of the conical flask via the rubber bung (essential to do quickly so that there is little time for the gas to escape when the reaction has started). The volume of gas is recorded at 5 second intervals for 1 minute. Repeat the above experiment using the following volumes of acid and water (cm3):
Exp. 1, 40:60 - 40% acid (0.8M/40cm3) and 60% water (60cm3)
Exp. 2, 45:55 - 45% acid (0.9M/45cm3) and 55% water (55cm3)
Exp. 3, 50:50 - 50% acid (1.0M/50cm3) and 50% water (50cm3)
Exp. 4, 55:45 – 55% acid (1.1M/55cm3) and 45% water (45cm3)
Exp. 5, 60:40 – 60% acid (1.2M/60cm3) and 40% water (40cm3)
10) Preliminary results table and comments about outcome, changes and problems:
* My comments on the outcome of the experiment;
All in all, I acquired very reliable results from the experiments. However for the 50:50, I decided not to take the average of all three runs because I suspected the first run to be anomalous, I think I had cut too much magnesium ribbon for that run causing the rate to be slightly higher than the other two runs, so the average amount of gas produced was calculated using only the second and third runs. I found out that as the concentration of acid increased, the change in temperature also increased. This was due to the fact that as we increase the concentration, the kinetic theory suggests that it will also increase the chances of a collision, which in turn will have a greater chance of producing energy from the collisions per second.
Changes:
- At first I used length 3cm magnesium ribbon, and then I found that it took a short period of time for the acid to react with all of it, and so I started using 5cm of Mg and found I got much more accurate and easy-to-measure results.
-
Before I measured the HCl and the water using measuring cylinders. I found that these were not very appealing to use as when I poured them both in the conical flask, it showed that they both did not add to produce 100cm³ of solution, so I turned to use the time-consuming burettes. These had eliminated the problem instantly.
- I also decided to measure the initial and final temperatures of the conical flask rather than the water trough. Also I changed from using hot water, to using cold water as I thought this would be more easier to maintain.
- I found that measuring the rate of reaction every 10 seconds was too long and with the 60:40 reaction, the reaction had ceased before 60 seconds. I halved the time period and therefore found more precise results as I thought considering we were only interested in the initial reaction it was better to measure every 5 seconds.
- I ensured that I folded the magnesium ribbon in half twice instead of dropping it in as a whole because i found that it would plunge into the mixture and one half would still be out because it was quite long, but by folding it I made sure that every part of the magnesium was reacting at the same time.
- I am going to decide to lengthen the overall time period of the experiment to 1 and a half minutes.
Problems:
I found that when using the burettes, even though there was a 0.1M concentration difference between exp.1 (0.8M concentration) and exp.2 (0.9M concentration) the rate of reaction seems to have been similar (i.e. after 10 seconds both reactions produced 5cm³ of gas. However if we take exp.2 (0.9M concentration) and compare with exp.3 (1.0M concentration) we find that after 10 seconds have elapsed, exp.3 had produced 10cm³ of gas considering it is only 0.1M more concentrated. But before when I was using measuring cylinders to measure the amount of water and HCl this problem did not happen, I think there is an error here and this could have possibly been caused by measuring mistakes, I might have measured the wrong amount of HCl or water. But other than that and the anomalous run for 1.0M concentration, no other problems were found in my preliminary results.
iii) RESULTS:
iii) GRAPHS:
(Please see the other document which contains the graphs)
Comments: Generally the graphs seem to be steeper when the concentration has increased, which is what I expected. However for the first graph, there seems to be a slight error with the run 2 best fit curve. It shows an almost S-shaped curve rather being straighter like the other two. Bearing in mind, that the results for that particular concentration were consistent but this has not been reflected on the best fit curves.
iv) ANALYSIS:
1) To calculate the initial gradient we use this equation;
Rate (gradient) cm ³/s = Rise (cm ³)/Run (secs)
2) Table showing the three initial gradients (i.e. rates) for each concentration:
3) Average initial gradient (i.e. rate) for each concentration:
4) Anomalies found in the rates:
As you can see there is a steady increase in rate as the concentration increases in 0.1M, however there seems to be a huge gap of difference between 0.9M and 1.0M, as the trends in my rates show an increase of roughly 10cm³, but here we find a difference of more than 40cm³. I think that there has been some flaw while conducting that particular experiment or if I made measuring errors. But it is also highly likely that I have not reacted sufficient magnesium ribbon with the acid, which could suggest for the declined rate.
Either way this shall be accounted for later when I use this data to construct a graph, showing the effect of concentration against rate. I am not going to choose to discount this anomaly from the table because I will want to show the prominence of the anomaly by drawing a best fit curve on the graph.
5) Graph showing how initial rate (gradient) varies with concentration:
(Please refer to the document containing the graph, entitled “Graph to show the variation of rate with concentration).
6) A description/summary of the graph:
According to my predictions, the line should actually be straight if the experiment was done accurately, but we find that there is somewhat a problem with the 0.9M concentration (circled in blue). This is why I am going to count this piece of data as anomalous. Other than that the line seems to be straight and close to directly proportional. The graph generally shows an increase in rate with an increase in concentration, but if I imagine the line to extend to 0M concentration (the line in black), I can picture that the line will miss most of the points and that it won’t be match my average initial rates. Now for the final prediction, I will predict that if I had done the 0.9M experiment properly, my average initial rate for that experiment should be placed accordingly (see the enlarged dark blue mark), this nicely fits into the original best fit line, so even though I haven’t managed to accurately get the correct results for the average initial rate, I can predict what it should have been anyway.
We can now talk about the graph’s shape in terms of the kinetic theory. The theory states that increasing the concentration of a reactant increases the chances of a successful collision, meaning more collisions per second and of these collisions more will obtain with energy greater than the activation energy, and therefore the rate of the reaction increases. By looking at the graph we can see that the theory has indeed been clarified well, as we see a positive curve, with rate increasing with concentration. But suppose if we double the concentration, we would expect 2M HCl to react twice as fast as 1M HCl because there is two times as many HCl particles in solution and so there are twice as many chances of HCl and Mg particles successfully colliding with each other, theoretically causing a reaction twice as fast. The black line is directly proportional, but my best fit line (red) showing the best fit line for the concentrations which I chose, don’t seem to be directly proportional.
7) Did my predictions come true?
Overall, I must say that I did not get the results that I would have expected to get. Looking at the diagram (fig. 1), I did predict that there would be a slower rate for the lower concentration and a higher rate for the higher concentrations, so technically, I have proved my predictions to be true. However if we look at the next diagram (fig. 2) my predictions were that if we doubled the concentration then the rate must also double. But going back to my graph (showing variation of rate against concentration) we have found that we did not expect the behaviour as anticipated, we can see by the line of best fit that for 0.6M concentration we have an average initial rate of 0.8cm³/sec. So if my theory should be proven correct, for 1.2M concentration we should be finding a rate of 1.6 cm³/sec, however by using the graph it seems to display that I get a 1.15 cm³/sec rate. I can conclude by saying that my experiment has not been proven to be directly proportional as the line seems to be less steeper suggesting that my results are not entirely accurate. This can be confirmed by the kinetic theory because, if we have 100 collisions with 5% having energy greater than the activation energy, and if we double the amount of collisions to 200, the we should have 10% which have energy greater than the activation energy, so there has been a flaw in my experiment which I will explain in the evaluation. Perhaps, I have not managed to successfully control all the other variables…or maybe if I made measuring errors…or if there was a problem with the apparatus? (gas syringe not functioning properly, movement of syringe not being as smooth, so not collecting the correct data)…
v) Evaluation:
1) Quality of observations:
An estimation of the accuracy of all the observations and measurements:
I would say that the accuracy of the measuring is not 100% exactly right. This is because we cannot ensure that we will measure each volume of solution to the set amount that we need. Burettes help reduce this problem to a minimum but I am sure that it is guaranteed to produce measuring errors. The water bath, I did not monitor the temperature of the water bath throughout all of my experiments as I only tried using cold tap water. Also the timing, I have said to measure the reaction every 5 seconds for a minute, but again we can’t be certain in saying that we have timed the reaction exactly every 5 seconds, as it will take some time for us to read off the stop clock and then note down the result. This might not seem a concerning issue if done once, but if done when recording all the results it could ultimately be disruptive to the experiment results, therefore causing slight glitches in the graphs too and reducing the accuracy when we read of these graphs to calculate gradients. Measuring the length of the magnesium ribbon is also something which had been a problem in my experiment. I found it hard, even when using a ruler, to exactly get the 5cm, but I can only predict a few millimeters in fault. Lastly, the fact that we need to put in the magnesium ribbon into the conical flask, attach the rubber bung and start the stop clock, all at the same time had proven difficult, so I can say that if we take all these minor problems, I think they combine to cause a significant change to the experiment and help reduce the accuracy of the results. There are only a few positive points and I can say that the most of my runs were accurate as they seemed to follow a certain trend.
Comments on unexpected results which occurred, if any. How I recognized them and dealt with them:
As I said before, I did get an anomalous experiment in my investigation and it is shown below:
Looking back at the 40:60 experiment, we see that this very identical to that. So I can say that there are unexpected results, and due to that I have taken the liberty to predict what the real set of results for the 45:55 experiment should look like:
I think that this is correct because this nicely fits into the graph trend, and we get a much straighter line suggesting a much more directly proportionate reaction. And so that is how I managed to fix that problem.
2) Improvements:
Practical way to improve my experiment next time:
Next time I am thinking of using a much more accurate way to conduct the experiment. I will gather volunteers so I can put the magnesium ribbon into the conical flask, attach the rubber bung and start the stop clock all at once so that there is little time for the gas to escape when the reaction starts. I will also ask for a partner to alert me each 5 seconds so that I can straightaway record the amount of gas being produced, so there is little margin for error in timing. I will use a bold marker pen so I can exactly mark out the length of the magnesium ribbon, and will use a much more precise ruler so that will help to reduce inaccuracy by measuring errors. Also if there is possibility, I will measure the amount of solution twice before I finally pour it into the conical flask, i.e. pour it into a measuring cylinder and then pour in a beaker and pour it back into the cylinder and see if the reading is the same (it may seem pointless but it is good to know that you have measured exactly the right amount so that we can’t mention it if we again experience problems). Also the gas syringe, I found that it did not fully plunge back to 0 when I reset it, and it only properly started moving after roughly 4 seconds when the reaction starts. I will make sure that my measuring cylinder next time is in full operating order and will test it before putting it into experimental use. If I manage to do those, then I think my next experiment will be much more successful.
3) Reliability/ Conclusion/ Fair test?
Was it a fair test?
I am going to strongly disagree by saying I do not think it was a fair test at all. For one thing, we did not do the experiment all in one day, we did a few concentrations one day and the remaining on the next week. This means that we cannot guarantee ourselves that we took for example; the acid from the same bottle which we used the first time, or the magnesium ribbon which we used from the same roll as we used for the first few concentrations. Different day means different room temperature, as on the first day it could have been cold but then the next week the temperature could have been much warmer in the room, which could suggest for the inconsistence of my results, as I only managed to do the first 2 concentrations on the first lesson and now we find that one of them do not seem to fully match the rest, which is slightly interesting. We didn’t make sure that we used the same gas syringe each time as (like I said before) I witnessed a gas syringe which was not in full functional order, so basically equipment was a problem, and that too not all the other variables were fairly controlled; temperature as I said was not kept constant as we did not manage to conduct all 5 experiments on the same day, and the acid which would not have been used from the same bottle, as contamination could have caused disturbances in the results. The water bath was not changed every experiment, it would have been heated up slightly as I conducted each experiment so that also isn’t fair. I found very little positive points about this experiment and I must be bold in saying that the exp was unfair and this has been reflected upon my results.
Are my results reliable, can they support a firm conclusion?
As I pointed out before, I don’t think by using my results I can fully say that the experiment I conducted was reliable. To me, an anomalous run is satisfactory and can be excluded and we can safely say that the experiment was reliable however an anomalous experiment is just extreme. It is as if saying that a fifth of my experiment was anomalous (as one of my five experiments was done improperly), which we can obviously say is simply not reliable as they have not shown to be completely consistent. Evidence of this is proven in the table where we see a very slight increase in rate as we increase from 40% to 45% acid concentration. However when we increase from 50% to 55%, and then from 55% to 60% we get a significant consistent increase. Also I have taken percentage variation calculations;
Exp. 1: (after 10 secs) 5cm³/s ± 2cm³/s
% variation…2/5 x 100 = 40%
Exp. 2: (after 10 secs) 5cm³/s ± 0cm³/s
% variation…0/5 x 100 = 0%
Exp. 3: (after 10 secs) 9.333…cm³/s ± 0.666…cm³/s
% variation…0.666/9.333 x 100 = 7.14%
Exp. 4: (after 10 secs) 11.333…cm³/s ± 0.666…cm³/s
% variation…0.666/11.333 x 100 = 5.88%
Exp. 5: (after 10 secs) 13.333…cm³/s ± 0.666…cm³/s
% variation…0.666/13.333 x 100 = 5%
As we can see we find some consistency in the final three experiments but we simply get very awkward data from the first two. We can further point out this evidence by looking at the “rate against concentration” graph, where I have circled one average rate which did not follow the graph trend; this is showing inconsistency as it does not match with what the rest of the data has shown us. So as I have said above, I am not happy with safely concluding this experiment due to the fact that I did not get the results that I was expecting and all my evidence showed inconsistency which I have to acknowledge. By looking at the graph we see we don’t get the directly proportional linear line that we were aiming for and the fact that it was not a fair test simply made it difficult for me to conclude.