Prediction
I predict that the higher the enzyme concentration, then the higher the rate of catalyse activity; this is because there will be more active molecule for a reaction occur. More active molecules give more chemical reactions since there will be more successful collisions at the active site of the enzyme and substrate. The rate of reaction is directly proportional to the enzyme concentration. This is because the enzyme concentration is increased which enables active sites to react with substrates, increase the rate of reaction.
Diagram 2- showing the effect of different concentrations on the rate of reactions in solutions using the collision theory
In this solution of starch and amylase there are only
a few amylase molecules to collide with the starch
substrate. This means is less chance of collision
occurring and a less probability of the enzyme being
‘locked’ by the substrate starch ‘key’. This means
there will be less effective collisions, reducing the
rate of reaction.
In this reaction, there are more amylase molecules,
this means that there will be more effective collisions,
as a result of increase in collision frequency. This
means more ‘lock and key’ reactions will occur
between the enzyme and substrate, producing more
products, which increase the rate of reaction.
I predict that 2% concentration of amylase will have the quickest reaction, as there will be more of its molecules in the water compared to 0.5% concentration of amylase, which will have the slowest reaction rate. This prediction is justified by the collision theory. As the concentration increases, the rate of reaction will also increase, as the time taken for a reaction to occur decreases.
As the concentration of amylase increases, so will the rate of reaction. This is because as we know enzyme lowers the required activation level. Therefore, if there are more molecules of amylase in the solution, there will be an increase in the weakening of covalent bonds in the substrate molecules. This means that it will react easier with the amylase, forming a product quicker. The rate of reaction is the time taken for a product to be formed or lost.
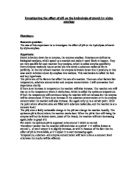
Graph 1- showing that having an enzyme in a reaction reduces the required activation energy, as I mentioned above.
I predict that my graph will have a positive correlation and will be curved, as the increase in rate of reaction will not be equivalent in value to the increase of enzyme concentration. This is because as the concentration increases, the initial reaction rate increases. However, as the reaction progresses the concentration of the enzyme, amylase will decrease. This is because there will be fewer particles to collide as the reaction continues
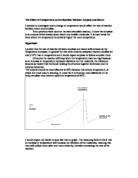
Graph 2- a graph showing my
prediction of the relationship
between the enzyme concentration
and the rate of reaction, being the time
time for it takes for the reaction to finish
reaction
to finish in
seconds
concentration of enzyme in %
The graph reflects my prediction that as the concentration increases, the time taken for the rate of reaction increases, as it takes less time for a reaction to occur
The exact relationship between the rate of reaction is dependant on the reaction ‘mechanism’. The nature of the reaction mechanism that controls the rate of reaction can only be revealed by experimental observation. This means that I cannot make a quantitative prediction about the effect of enzyme concentration on the rate of reaction.
Apparatus:
2cm³ of the five varying concentrations of amylase- 0.5% 0.75% 1% 1.5% 2%
Five-10cm³ starch with 1% concentration
Water bath at 80 c
Five test tubes
Test tube rack
10cm³ syringes
Clean pipettes
Benedict’s solution
Iodine solution
Ceramic tile with depressions
Stop clock
Plan and Method
There will be five different concentrations of amylase laid out on the table. Take separate syringes each time, so the concentrations are not mixed up, suck up 2cm³ of each concentration of amylase, and place them in five different clean test tubes. The five different concentrations will be 0.5% 0.75% 1% 1.5% 2%. Using the same method of sucking up the solution, take different measurements of 10cm³ starch. Make sure that when you measure the solutions using pipettes, and any other measuring equipment; you should measure at a flat level, under the meniscus so the measures of the solution are accurate. Ensuring each test tube is clearly labelled and placed in the test tube rack, take one concentration at a time, start with 0.5%. Collect a stop clock, which will be use the time it takes (in seconds) for a reaction to happen. However, a note must be taken that the time taken for the starch to disappear is not the time taken for the full reaction to finish. This means that we are only measuring the initial reaction rate for this experiment. Get the 10cm³ syringe with starch in it and push out the solution into the 0.5% amylase. Automatically after the last drop of starch has been added, start the stop clock. Using your pipette, which should be clean so it cannot contaminate the liquid in it. After starting the stop clock add a couple of drops of the starch and amylase solution into one of the depressions in the ceramic tile, which should have a couple of drops in the depressions. After this, instantly squirt the remaining solution of starch and amylase back into the test tube with 0.5% amylase. Continue this every 30 seconds until the colour of the solution in the depressions turns clear brown, which will indicate a full reaction can occur. Repeat the procedure for each different concentration of amylase. Then repeat the procedure again for each different concentration of amylase are accurate and reliable.
The iodine solution is to test for the presence of starch; the original colour of the iodine solution is orange, there is no starch present at this time. However, when you add the solution of amylase and starch, starch is obviously present so the solution is a purple/blue/black colour. As the reaction progresses starch is broken down into maltose, which is a sugar. If this occurs, then the colour of the solution in the depression will be clear brown. To be sure, that the solution you are left with is sugar, Benedict’s solution is added. In each solution of amylase and starch, add ten drops of Benedict’s solution. I will then put the five test tubes in the waster bath at 80 c, this will give the solution enough time to change colour. If the solution turns orange, green, or even yellow, sugar is present. This means that a reaction has occurred and starch has broken down into maltose.
I am investigating the effect of the concentration of enzyme on the rate of reaction. The only thing that will vary in my experiment is the concentration of the enzyme. This will mean that all the tests will be the same, so the experiment should be accurate and most of all fair. All other variables will kept constant throughout the experiment.
The pH level also influences the rate of reaction, so it must be kept constant. Every enzyme has an optimum pH, which is the best condition for the enzyme to breakdown the starch fastest. I f the pH level is too strong the enzyme will be denatured and effect the rate of reaction by reducing it. If I had the facilities, I could use a pH buffer so the rate pH level would be constant.
Temperature during the experiment should be kept constant. It is important the temperature remains constant in all the experiments because otherwise it will have a great impact of the results. Increasing the temperature increases the Kinetic energy of the molecules. Amylase molecules will therefore collide more, resulting the starch to be taken up by the active sites of the amylase, broken down quicker and maltose to be released. This will cause an increase in rate of reaction. However after the optimum temperature, which is above 40 c, the ionic and hydrogen bonds holding the amylase together will brake and denature, so the reaction will no longer occur. I will keep the temperature constant by keeping it at a mild temperature so the enzymes do not denature. I must keep all the test tubes all at the same temperature so that it does not matter if the temperature increases the rate of reaction because all the temperatures in the test tube will be the same and the effect of temperature will not be obvious.
Graph 3- a graph to show the effect of temperature on the enzyme activity. As the temperature rises, the rate of the catalysed reaction increases proportionally until the temperature reaches the point where the enzymes denature. The rate of reaction steeply decreases as the denaturising continues and becomes complete.
Substrate concentration also has to remain constant. If the substrate concentration is low, collision between enzyme and substrate, molecules are infrequent and reaction continues slowly. As the substrate concentration increase, the initial reaction rate is proportional as collision between the molecules becomes more frequent.
Graph 4- the effect of increase in substrate concentration of the rate of an enzyme-catalysed reaction. At saturation, further increase in substrate reaction does not affect the rate of reaction.
I am going to keep the substrate concentration constant at 1% so the rate of the reaction is not affected. If there are more enzymes than substrate molecules and then substrate is added, the rate of reaction will increase because there will now be more active sites available for starch to be broken up but if there is enough substrate to occupy all the active sites on the enzymes then the rate of reaction will not alter. Therefore, I will use the same amount and concentration of amylase.
Enzyme inhibition affects the rate of reaction so must be kept constant. Enzymes combine briefly with their reactants; this makes them vulnerable to inhibition by unreactive moles that resemble the substrate. The inhibiting molecules can combine with the active site of the enzyme but remain bound without change, which blocks off access by the normal substrate. As a result, the rate of the reaction decreases. If the concentration of the inhibitor becomes high enough, the reaction may stop completely. Inhibition of this type is called competitive because the inhibitor competes with the normal substrate for binding to the active site. Some inhibitors interfere with enzyme-catalysed reactions by combining with enzymes at locations outside the active site. These inhibitors rather than reducing accessibility of the active site to the substrate, cause changes in folding and formation that can reduce the ability of the enzyme to lower the activation energy. Because such inhibitors do not directly compete for the binding to the active site, their pattern of inhibition is called non competitive. To ensure inhibitors do not influence the experiment, none will be involved.
Results
Table 1- results of my two experiments.
The results show effect of enzyme concentration on the time it takes for the hydrolysis of starch to occur.
Table3 – showing the class results. The time in each reaction is measured in seconds and the results were from eight different people. Results are taken for the five different concentrations.
Conclusion
My graphs of my results all show that the time differs as the concentration increases. However, my results were different from that of the classes. My results were on average lower than the classes’ average results. For example, at 1% concentration of amylase my average results told me that the time taken fro the initial reaction rate to finish was 105 seconds. Yet, my average results from the class presented this to be about 160 seconds.
Despite the difference in recordings of time taken for a reaction, my results appear to be reliable. My graph shows a curved shape showing positive correlation. This was just as I predicted. The graph of my results also reflect my prediction that the concentration of the enzyme would be proportional to the rate of reaction in the sense that as the concentration increases, the rate of reaction increases as it takes less time for a reaction to occur. The trend lines in al the graphs were not straight passing through the origin. This shows that my prediction was correct and my results support the prediction very well. This is because, as I stated in my prediction, the rate of reaction increases as the concentration increases.
The theory of my prediction and the reason for the justification of the results is the collision theory. The time taken for a reaction to occur is made shorter by increasing the concentration of an enzyme. This is because high concentrations of enzymes are composed of more molecules than those of lower concentrations. This results in more collisions being present. The collisions must have enough energy impact to overcome the activation energy, and must have proper positioning. This is so there will be an increase in frequency of collision, which results in an increase in the number of effective collisions. Therefore, the rate of reaction will increase.
The reason for my successful prediction, and reliable graphs also proven by the two hypotheses of enzymes. The ‘lock and key’ hypothesis explains how the enzyme is the ‘lock’ and the substrate is the specific ‘key’. In my experiment, I had a certain number of moles, or a certain number of ‘locks’ in the solution. The substrates fitted into the active site, combines so a reaction occurs. This led to the substrate amylase, which is the key to form products that are released form the active site and the substrate in the solution of starch and amylase causes the active site to adjusts around the substrate for an effective fit, which induces the catalysis. Increasing the concentration of enzymes therefore increases the number of reactions occurring between the substrate and the enzyme.
Hydrolysis is the process of decomposing molecules by adding water. Amylase sustains starch in the best position for water to react with, it ensures a higher probability or chance of collision with the starch molecules, because of its superlative position. This means that increasing the concentration of amylase would result in a higher probability of successful collisions.
I predicted that the rate of reaction would be affected by enzyme concentration proportionately. I discovered during the experiment that at low concentration the few enzymes are in perpetual reactions; in the sense that as soon as the products are released from the reaction, the enzymes take another substrate molecule, so the enzymes is working at the optimum rate and not all substrates being used. As the concentration of the enzyme increased, more substrates react with the enzymes, which still work at the maximum rate. As the maximum rates of each enzyme of the amylase are identical, the rate of reaction must have increased proportionally. This is the case until when the molecules started to work below the maximum rate because of low enzyme concentration or substrate concentration, which we know has an effect on the rate of reaction. This is the point where in my graph a curve begins to appear. I predicted this would occur. This means that the rate of reaction will increase proportionality until the enzyme concentration no longer yields an increase in rate of reaction. This means that my prediction was only partly correct and I should have acknowledged the fact the reaction does not increase proportional until the end of the reaction.
Calculating the gradient of the graph would have the determined the direct relationship between the rate of reaction and the enzyme concentration. However, since none of my graphs presented a straight line through the origin to be perfectly proportional to the enzyme concentration, I could not do this.
From the results, I can see that 2% concentration took the fastest time for an initial reaction to occur. Although the various results record different times, they still show that the concentration decreases as the rate of concentration decreases. 1.5% has a higher rate of reaction than 1% or 0.5%. 0.5% had the lowest rate of reaction.
Evaluation
My results were valid as they had a reasonably suitable graph of rate of reaction and have an acceptable conclusion. My experiment obviously had a degree of error and this influenced the results. However, I did try to ensure the experiment was not altered by other variables. I tried to make sure the temperature through the experiment was kept constant. The experiment was conducted over the period of two days. This meant that during this time there could have been an increase or decrease of temperature which either way could influence the rate of reaction. Day 1 of the experiment was reasonably warmer than the previous as I did detect an influence on the experiment. The results from my experiment on day 1 had a much lower time than for the time needed for a reaction to occur on average compared to day 2. The reason for the difference of results is that an increase in temperature provides an increase in kinetic energy, which will result in collisions that are more successful, which increases the rate of reaction. The great impact of the differences in temperature have on the results can be seen in the class results. In these results, the range of time taken for reaction is too large for there to be a proper analysis of the results. Despite the extreme ranges in time taken for a reaction, there was only one anomaly present in my results; this was in the average for the class results, which was too high for what was expected there. I could have controlled the temperature by conducting the experiment in a water bath at a constant temperature. In addition, despite the fact that temperature does influence the rate of reaction, it would be irrelevant as the effect will not be obvious.
The pH level could have also affected my results largely. This is because I did not use a pH buffer to control the pH of the solution and we know that pH level strongly influences the rate of reaction because if the pH is too high it will denature the enzymes.
The starch used on the two days were different, this means that one could be warmer than the other could. I f the temperature is varied the rates of reactions will be different. Some of the equipment used could have influenced my results by being contaminated.
There were also no inhibitors in my experiment, which ensured none of the enzyme molecules’ active sites were blocked by inhibitors, which they were would decrease the rate of reaction.
The starch solutions were at different temperatures when used, this added to the unreliability of the experiment as temperature influences the rate of reaction. In the experiment, I used different standards of judging when starch was no longer present; I would stop the stop clock at different concentrations. I should have waited for the iodine to be clear brown to be definite starch was no longer present. The best way to measure when the starch had gone was to use a colorimeter. Colorimeters are sensors that stimulate the way the human eye sees colour and quantify the differences in colour. They take measurements using the same light source and illumination method. As a result, the method for measuring could have been the same quality regardless of the environment placed in. They give quantitative assessment of colour.
I should have collected more data and did the experiment more than once, so my results could have been more accurate. However, I should ensure that other people’s experiments had its variables properly controlled and the time taken for a reaction was not properly measured, this is due to the fact that person 6 and 7 did not measure the experiment every 30 seconds. So that my results are more accurate, I would measure the time taken for a reaction in intervals of 10 seconds.
I could have extended my studies in enzymes by analysing other factors that influenced the rate of reaction. If I was going to investigate the effect of temperature on the breakdown of starch by amylase. The aim of this experiment would be to investigate the effect of temperature on the rate of reaction. The independent variable in this experiment would be temperature and the variable dependant on this would be starch concentration. All other variables would be kept constant to ensure that the experiment was a fair test. The concentration of amylase and starch in the solution, time of which the experiment was conducts, and the volume of starch and amylase solution.
The experiment would be conducted as follows: Two test tubes would be taken, with equal amounts of starch and amylase solution. The contents of the two tubes would then be combined in a separate tube, and a timer started. Then, every minute, a sample of the mixture would be taken using a pipette, and placed on a ceramic tile. A drop of iodine would be added to each drop. The colour would be noted and a colorimeter used to measure the index of concentration. The index of concentration would then be noted in a table for each sample. I would then plan to determine the range of temperatures to test, the volumes of starch and amylase solutions to use and the concentrations of these solutions after conducting a pilot study.
I would use 10cm3 of 2% starch solution and 10cm3 of 0.01% amylase solution in the two initial test tubes for the main experiment. It would prove easier to; before the experiment was started and while the starch and amylase were acclimatising, set up a tile with, iodine drops already on it, in the depressions on the tile. A drop of the solution collected during the experiment could then simply be added to this and the colour noted. I would not note the index of concentration, as this would be impractical, and instead just note down the time after which there was no more starch present in the solution. In order to decide at which point there was no more starch present, maltose solution will be mixed with iodine in a beaker. This provides an indication of what colour the iodine would turn if there were no starch present, but there was maltose, produced by the enzyme. I would conduct the main experiment between temperatures of 20oC and 70oC inclusive. 20oC is the lowest temperature at which the enzyme could function at all effectively and that the enzyme would denature possibly at 70oC and definitely at temperatures above that. The main experiment would be conducted at 10oC intervals between these temperatures in order to obtain a sufficient number of sufficiently dissimilar results.
Throughout the experiment, safety precautions would take to ensure that the experiment was conducted in a safe manner: safety goggles and a lab coat would be worn at all times. All parts of the experiment would be undertaken with care, to ensure that there was no spillage. Any spillages of iodine or starch would be washed thoroughly with soap and water. If any starch solution, iodine indicator or amylase were accidentally ingested, medical attention would be sought immediately.