Collecting Data
Nickel
Copper
The table shows that the longest wires in both metals have the highest resistance due to the fact that there is a longer path for the electrons to travel which means there are more collisions with the atoms. Evidence for this is that the resistance increases as the length increases. But there is one outlier in the current which came from copper. This is because of copper not being as stable as nickel. In fact all the figures for the current in copper seems wrong because there is there are big gaps between two pairs of results, (8.06, 8.08 and 7.78, 7.41)
Apparatus/Equipment:
- Variable Resister
- 1metre Ruler
- Power Pack
- Volt Meter
- Amp Meter
- 1metre copper wire
- 1metre nickel wire
- Crocodile Clips
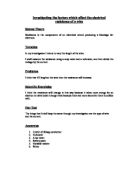
The factors which were involved were the heat, current, length and wire. The factors which we change intentionally was the length and we do this by using the 1metre ruler to allow us to be able to measure the length of the wire so that we were able to place the automotive clips on both sides of the required length. A secondary factor is the current because that changes as we change the variable resister and length. A factor which we don’t have much control over the heat because it would be hard for us to be able cool down the wire, and the heat effects the resistance because it causes the atoms to vibrate more.
Apparatus/Equipment:
- Variable Resister
- 1metre Ruler
- Power Pack
- Volt Meter
- Amp Meter
- 1metre nickel wire
- Crocodile Clips
The difference in this method is that we would only experiment on nickel due to the fact that it is the most stable wire to record results from. This is my main table showing that length increases resistance in wire. I can see that my table makes my work appear that it has really reliable results because with most lengths the ranges between the values are very close together or exactly the same. This proves that our method was good enough to get accurate results. There is a correlation between the length and resistance as shown by my table. But I do have some results which do have quite a big range, this might have been due to the fact that the temperature was too high and that we did not leave the wire to cool down or we left the wire on too long.
Variable Effect How it was Controlled?
Interpreting Data
My graph gives a clear indication that the length causes an increase of resistance. Evidence of this is that my graphs line of best fit has a positive correlation which is strong evidence that the longer the wire the higher the resistance. My results are also accurate and I can see this by the error bars, the error bars which I have are very small which means that the ranges between the values are very small. But I can see that at length 40cm my error bar is quite big and I would expect this to be from common human error e.g. incorrect measurement for the length and inaccurate readings; another fault may have been that we may have not left the wire to have cooled down so the heat continued to rise as were carried out the experiment for length 40cm. The fact that my results don’t overlap on the y axis shows that my results are reliable. The scattered points on my graph are also right on the line of best fit or very close so my points are not scattered across the graph which proves that my data is reliable due to the fact that it has a positive correlation, which logically is something that we would have expected.
What I have also noticed about my graph is that on averages my graphs formula based on the subject of inequalities the formula would be. This means that this pattern would repeat its self for ever giving a positive link that the increase in distance electricity travels, increases the resistance. Since the line of best fit is a straight line it shows that the correlation lasts will always continue.
Overall I would say that my graph is very reliable because it shows a clear link between length and resistance with an inequality formula and small error bars.
Evaluation
In total we have collected 30 results which I would say is enough because we were able to get an average and make a link between factors which were involved with the resistance in wire. The data was enough to make a conclusion because we were able to get strong evidence. My results were very accurate and I could tell this by my results; the range between values were small which means there were very little faults involved and in my graph we ended up with the predicted correlation. In my graph all my results fit with the pattern which is strong evidence that my results are reliable. The only set of results that I think should be repeated is length 40cm because the range is quite big. I believe that my data is sufficiently reliable because that all fit with the pattern, but if repeats were taken and there were differences then that would be important because it indicates that other testes might have been inaccurate and worth a repeat. I would say that my results can support a firm conclusion because my graph appears to show that hardly anything went wrong due to the positive correlation and the error bars. Because I have very reliable results I am able to make a firm conclusion because my results would be able to support my conclusion.
Evaluating Method/Procedure
A problem which I did have with my method is what we used the automotive clips to each end of the length of the wire; this was a problem because due to the thickness of the wire the length measures may be inaccurate causing the length to increase or decrease by maybe 1cm. Another problem with the method is that we had no instruments to cool down the wire if it gets too hot so we had to waste our time by waiting for the wire to cool down. The equipment that we used was appropriate because we had the equipment needed to get good enough results to make a conclusion. Our control on other factors involved in resistance was in a way controlled e.g. heat. We would wait 20s on each test so that the wire can cool back down to room temperature and the wire would only be on for a maximum of 5 seconds. The fact that we did all the test in one day meant that the room temperature would not have changed and if were to do the tests on other days it could give odd results because it’s likely that the temperature of the room will change every day, so doing the experiment all in one day meant that the environment did not have much of an impact to the temperature of the wire. Our results were quite precise because we used instruments such as variable resisters which allow us to control the current and a volt and amp metre which gives us a digital read out of the figures, we copied the numbers by 2 decimal places so that made our results precise. The readings from our equipment can be very accurate if there were no common human errors because the digital readings from the volt and amp metre are very precise. To make our results more accurate and reliable was if we were carrying out the experiment in a temperature controlled room so there would be not extra heat on the wire to cause extra resistance by causing atoms to vibrate. I would also remove the automotive clips and replace them with something much smaller because the thickness of that would alter the length of the wire and resistance.
Reliability of Conclusion
Other measurements I would have taken to make my conclusion more certain is that I would repeat the whole experiment again and then get an average so that I would get a more accurate result making my conclusion more firm. What shows that my conclusion is reliable is that my graph proves that if I have more metal lattice then the resistance to increase because there would be more atoms stopping the electrons to pass through the wire which increases resistance. But the reason why my conclusion is not perfect is because of the limitations which is had more example; as the electrons were passing through the wire, it causes the wire to heat up due to friction from the electrons hitting the metal lattice which would cause an increase in resistance because the heat created by the friction causes the atoms in the wire to vibrate more thus blocking more elections and as the resistance increases it cause the metal lattice to heat up even more which adds more resistance to the wire. Other limitations were the length of the wire. Since the wire was not stretched out when we were measuring the length of the wire so there would have been hidden lengths while we were measuring the wire. Since the readings of the lengths were not accurate we were likely to have gotten results for a different length. Another limitation was the automotive clips, the thickness of them may have added more resistance to the wire and could have causes the readings to be inaccurate because the added length would have increases resistance therefore giving odd results which is why a very few error bars were slightly bigger than the rest. But since most of my error bars are very small it proves that my conclusion is reliable.