** I chose 90cm as 100cm was the length of the ramp, and therefore it would be difficult to set up the apparatus.
In order to make my results reliable I am going to use certain equipment to take accurate readings, i.e. the light gate which will give me an average reading automatically. To make sure my weight readings are accurate I am going to use scales to weigh the original mass of the car to give me a starting point for the range of reading I will take. I will also use 1g weights to make sure the mass is accurate; this is a good idea as it will save me time, as I won’t have to measure out 1g in blu-tak every time I increase the mass.
In order to reduce the chance of anomalies I am choosing to repeat my experiment three times and take another average.
Range:
My preliminary work showed that there was a change in speed every few grams and therefore I will continue to use this information for my actual experiment. I will start at 25g and do readings every 1g up to 35g.
Safety:
In order to make my experiment safe I will make a “crash zone” made of blu-tak for the car to run into when it comes off the ramp this will absorb the impact of the car and will ensure that it doesn’t fly off of the work surface and cause damage. I will also wear safety goggles incase this event does occur.
Method:
Set Up:
- Set up equipment as shown in the photo
- Set the ramp up 25cm from the work surface
- Set the light gate at 90cm from the second clamp stand i.e. the clamp stand holding the ramp up 25cm from the work surface.
- Set up the laptop to record the data collected.
- Set up “crash zone” area for car
Experiment:
- Weigh the car on the scales along with some blu-tak and the card. Make sure the total weight comes to 25g, you can add and remove blu-tak
- Blu-tak the card to the car.
- Making sure the recording software is on; place the car 10cm from the end of the ramp (90cm from the beginning as the ramp is equal to 100cm).
- Let the car roll down the ramp – making sure not to apply any force to the car.
- Repeat this three times and take an average.
- Record the data in an example table as shown below.
- Add 1g in weight and repeat the experiment until the maximum weight is obtained i.e. 35g.
Example Table:
I must remember to highlight any anomalies that I find and repeat them so as to make my results accurate.
Results:
I think that a clear and concise way of recording my data would be to put the data I have obtained in a table in excel as this makes it easier when drawing graphs. The table format also allows me to identify anomalies easily.
= Anomalies
I felt that 1.216 was too low compared to the other two results. When looking back over my data I realised that it should have been 1.316, this is why I have added an extra column in just that row, to accommodate the two different averages. I am going to discount the original average and use the correct one when producing my graphs.
I re-produced this table on the page overleaf. I added a trendline to see if there was a general trend.
Analysis of Graph:
From the graph we can see that the points are very randomly scattered and do not follow a general pattern. This means that there is no correlation, but the fact that I added a trendline tends to suggest I have a very weak, negative correlation as the trendline slopes downwards.
This graph tends to suggest that there is mass does not affect speed in a way that it would be important. It might be an idea to of continued adding weights to the car, to see if there is a point in which speed starts to decrease, or even increase when heavier weights are added.
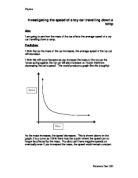
My original prediction was:
I think that as the mass of the car increases, the average speed of the toy car will decrease.
From the evidence I have obtained I don’t think there is enough evidence to support my prediction, even though the trendline does tend to suggest that there is a negative correlation i.e. that as the mass increases the speed decrease – which would support my prediction.
When working out the speed of an object, we take into count two things, the distance and the time. Mass is not mentioned. Therefore mass not being in the equation for speed suggests that mass does not affect it as such.
Evaluation:
I think in order to improve this piece of work I would have to have more masses in order to draw a solid, final conclusion. I produced a set of results that were accurate and gave me suitable data. The anomalous result was accounted for and corrected. The method was as fair as possible as it was being done in a school laboratory. The only thing I would change is getting a wider range of results.