I believe that as the concentration of trypsin used in the reaction is increased the rate of the reaction will increase proportionally, as there is more trypsin available to react with the milk that is present. The two factors are directly proportional.
I believe that as the concentration of milk is increased the rate of the reaction will increase, given that there is less chance of trypsin not reacting due to limited impacts with milk. It is also my belief that the final product of digested milk will be greater as there is more milk present in the first place to be digested.
Predictions
I believe that the temperature at which the reaction is undergone at will be directly proportional to the rate of reaction up until the point of Trypsin Enzyme’s denaturisation.
Pilot Study
Four different sets of experiments can be carried out to produce results showing how temperature, PH, concentration of trypsin and concentration of milk will affect the rate, and overall product of the reaction.
The stated variables can be individually varied to assure a fair test and to show how each one affects the reaction on its own. Results will be recorded for a wide range of values in the differentiation of temperature, as this is my chosen variable. This will ensure that anomalies that do occur have less affect on the overall conclusions drawn from the results.
Method:
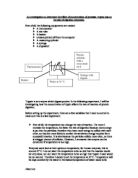
Temperature – 2cm3 of 1% trypsin solution should be measured out in a measuring cylinder. This should then be stood upright in a water bath that is set at 40 degrees Celsius. A further 5cm3 of 4% milk solution should be measured out into a measuring cylinder and poured into a different test tube. This test tube should then be placed upright in the water bath in the same fashion to the other test tube.
The water bath should be monitored for temperature changes, and kept at a constant level of 40 degrees Celsius. The 2 test tubes should also be monitored for temperature change. Only when both are at the same temperature as the water can the experiment start.
Note: separate thermometers should be used to measure the temperatures of the different solutions. This should mean that neither solution is diluted and the reaction does not start earl by small amounts of the milk and trypsin being mixed. Also, when pouring trypsin solution safety goggles and gloves should be worn due to the digestive nature of trypsin.
Once the temperatures are both at 40 degrees Celsius pour the trypsin into the milk solution, and start a stop clock to record the time taken for the reaction to be completed.
The test tube in which the reaction is occurring should be gently shaken, or stirred with a thermometer while kept in the water bath to ensure that all of the different solutions mix together at quickly as possible. The solution should be constantly observed. When the solution turns from a white misty colour to a clear colourless solution then the reaction is over. At this point the time should be recorded. Personal discretion should be exercised here as to when the solution has finished reacting. This means that it is important that the same person grades all of the results to maintain moderate accuracy.
The experiment should be performed a further 2 times making sure that all variables are kept the same so that an average can be taken from the results.
The experiment should then be repeated a further 3 times using a water bath set at 60 degrees Celsius. This will show when compared to the other set of results how the temperature at which the reaction occurs at affects the rate at which the reaction occurs.
Results:
Apparatus
Water bath x 4, (at 20, 40 60 and 80 degrees), glass beaker, ice, test tubes, trypsin solution, (1%), milk solution, (4%), Pipette, thermometer, measuring syringe, (25 cm3).
Method
2 cm3 of 1% trypsin solution was taken and measured out into a measuring cylinder. This was done with care due to the digestive nature of the enzyme when in contact with proteins such as human skin and eyes. The amount of trypsin was assumed my reading the level of the bottom of the meniscus against the measuring cylinders scale, (this, due to human perception is only accurate to the closest tenth of a cm). This solution was then placed in a test tube.
5 cm3 of 4% milk solution was then measured out in the same manner as the trypsin solution, (in a 10 cm3 measuring cylinder). This should again be poured into a new test tube.
Both test tubes were then placed in the same water bath, (set at 20 degree Celsius). The temperature of each test tube was then monitored with a thermometer, until it reached the same temperature as the water bath, (in this case 20 degrees Celsius). At this point the timer was then started and the test tubes were left for 5 minutes to fully acclimatise. This will be long enough for enzymes to fully denature. Preliminary work shows that Trypsin enzymes will not denature at 60 degrees Celsius. This being the case a new water bath will be set up at 80 degree Celsius. This will ensure that results from the experiments show fully the effects of heat upon enzymes such as Trypsin.
After 5 minutes the stop clock was reset. All of the trypsin was then poured into the milk solution, (it is important that this is done in one go as otherwise some of the trypsin will not be reacting for as long as that poured into the milk solution first). The timer was started and the test tube containing a mix of both solutions was then placed back into the water bath.
The appearance of the solution was closely monitored. When the reaction was over the stop clock was stopped and the time taken was recorded. The end of the reaction was signalled by the milk and trypsin solution turning transparent. This however was not an accurate way of measuring if the reaction had totally finished, as the solutions in my preliminary experiments never went completely clear. This is why I decided to use a more comprehensive test.
A protein test can easily be carried out by mixing up a solution of 5 cm3 of sodium hydroxide and 5 cm3 of 1% copper sulphate. This solution was the placed in the dips of a dimple tray. As the reaction start to end, (when the milk starts turning transparent), a pipette can be used to drip a single drop of the trypsin milk solution onto the indicator solution. If there is still protein in the solution the indicator will turn purple. Only when all the protein is digested, (the end of the reaction), will the solution not turn purple. At this point the time should be recorded, as the reaction has ended.
It is important that the solution in the test tube is stirred before a sample is taken out and tested. Any remainder from the sample must then be placed back into the solution and stirred in again. Samples should be taken at regular 10 seconds intervals once the end of the reaction occurs so that the largest degree of inaccuracy is within the margin of 10 seconds.
Alternatively a machine can be used to test the transparency of the water, however the protein test is equally accurate and simpler to perform, (especially at speed).
This experiment should then be repeated a further 2 times so that a mean average can be taken from the results, (this should increase accuracy by compensating for anomalies that may occur). The apparatus should then be set up in an identical fashion, except that a water bath at 40 degrees Celsius, then at 60 degrees Celsius should be used.
Once results and repeats for all four temperatures have been taken the findings can be formed into a graph, (showing the relationship of temperature against the rate of reaction at 20, 40 60 and 80 degrees Celsius), which will highlight trends in the results, making a conclusion easier to form.
To supplement the results collected an extra temperature was set up. Here ice was used to provide a temperature near to 0 Degrees Celsius. To perform this experiment a beaker should be filled with ice and water. This should be monitored until it reaches 0 Degrees Celsius. When this is the case both the trypsin and the milk should be placed in the beaker with the ice and the temperatures should be monitored until both solutions are at 0 degrees Celsius. Then the reaction can begin and should be carried out in the exact same manner as any other.
Results
Analysis
The results obtained were plotted on 2 different graphs. These show the relationship between time taken and temperature and temperature in relation to rate of reaction, (1 divided by time). First the results were plotted on a graph of temperature against time. This showed a curved line, and the possibility of the 2 factors being inversely proportional. To test this theory I plotted a graph showing temperature against the rate of reaction. As rate of reaction is the reciprocal of time this graph should show direct proportion, (given that temperature against time showed inverse proportion the reciprocal of one factor against the other should show direct proportion). A graph of rate of reaction against temperature is also preferable to a graph of time against temperature as it is possible to plot the figures for experiment carried out at 0 and 80 degrees Celsius, as these will be zero, (1 divided by infinity), which will fit on a graph’s axes, while infinity itself is impossible to accurately plot on any graph.
The graph of rate of reaction against temperature did show that the 2 factors were proportional, but only up to a point. After 60 degrees Celsius the next temperature measurement showed that the reaction did not occur. I believe that this is because at some point between 60 to 80 degrees Celsius the Trypsin enzyme became denatured, (this is where the heat distorts the enzyme in such a way that stops it from functioning).
While it is said that rate of reaction and temperature are directly proportional this is not completely true. The graph plotted shows a slightly curved line from the reading at 20 degrees Celsius to the reading at 60 degrees Celsius, (the region of the graph that I believe shows direct proportion). I believe that curve is caused by some of the trypsin enzymes denaturising at a lower temperature, leaving the bulk of the enzymes to react proportionally faster until after 60 degrees Celsius. I believe this is why the effect becomes more prominent as the temperature continues to increase, (as more of the enzymes are likely to denature earlier than 60 degrees Celsius as there is a wider range of temperatures for them to denature at).
The enzyme also did not react when the temperature was at 0 degrees Celsius. In this case the enzymes are not denatured but simply lie dormant. Due to the cold temperature the reaction does not occur, as the biological enzymes will not function until there is a sufficient supply of heat energy. The exact point at which the temperature is too low for enzymes to digest at cannot be extrapolated from the graph, however I have put a dotted line on the graph to show, (according to the trend that the line of best fit forms), where I believe the maximum temperature at which the enzymes will not react due to their dormant state is.
From the graph it is clear that the fastest rate of reaction for the trypsin is when the temperature is at 60 degrees Celsius. When the temperature is at this level particles have more energy and so more collisions, (resulting in reactions) will be made between the trypsin and the proteins in the milk, meaning that the reaction occurs at a faster rate. This is true according to the collision theory which states that the more heat energy particles have the faster a reaction will be undergone.
My findings agree with my initial predictions that a higher temperature will result in a faster rate of reaction. My results also prove that it is true that this is only the case up until a certain point, Point of denaturisation. My prediction however implied that that this point would be around 60 degrees Celsius. This may be true if the enzymes used in the experiments were naturally occurring, however the enzymes used in my experiments were artificially manufactured. This means that they were not made in a living organism, so were not specifically designed to work best at the creatures natural body temperature. The artificial enzymes have a higher optimum temperature, (temperature at which they react fastest), and so also have a higher point of denaturisation. This means that the enzymes did not denature at 60 degrees Celsius as I predicted, so a reading at 80 degrees Celsius was taken. In this temperature the enzymes did denature as expected meaning that the reaction did not occur, so had the slowest rate of reaction possible.
Evaluation
I believe that the results recorded for the experiments undergone are reliable enough to base my conclusions upon. I believe that a suitable procedure was followed that ensured that all inaccuracies in readings occurred due to human errors in reading. A syringe rather than measuring cylinders being used avoided errors in the measurements of volumes of solutions. This left no room for inaccuracies in not accounting for the meniscus as a syringe will leave no room for a meniscus and bears detailed volume readings, (to the nearest tenth of a cm3). This procedure yielded fewer inaccuracies meaning that results were more reliable.
It was found out that the protein test used to determine when a reaction had finished did not function. This may have been due to the trypsin enzyme itself being a protein, however I believe that the test did not function correctly anyway as the solution used was supposed to start purple and change colour when protein was added, instead it turned blue and remained that colour indefinitely. Due to the protein test not working another system was employed whereby the transparency of the solution was gauged by observation. This meant that there was a larger error margin as to the definition of when the experiment had finished. Though this effected the accuracy of the results recorded I believe that the conclusions drawn were still accurate, as there was a large time difference between the results from the different temperatures that could not be mistaken even if the results were only accurate to the nearest 10 or 20 seconds.
I believe that my results show no anomalies, as the results shown on my graphs show simple trends with no obvious exceptions. Due to this continuity of results, (drawn from my graphs), I believe that my findings are accurate enough to base my conclusions upon.
I believe that the investigation could be further explored by experiments being performed at 10 degrees Celsius temperatures intervals ranging between 0-80 degrees Celsius. This would help to verify trend in the results and would show to a greater degree of accuracy the exact temperatures at which the reactions cease to occur. The results would show more accurately how steep the curve from the optimum temperature past the point of denaturisation to the point where the reaction doesn’t occur is. This would show more accurately the temperature at which the reaction stops occurring. Equally the point at which the trypsin is dormant, and does not react at could be ascertained to a higher degree of accuracy.
The investigation could also be furthered by performing the same experiment, under the same conditions on natural enzymes, thus showing how the optimum temperature and point of denaturisation differ between the 2.
The effects of Ph upon trypsin enzymes and the effects of the concentration of both the milk solution and the trypsin solution could also be investigated. I believe that the investigation of these factors would help to illustrate how enzymes are specific about the environment in which they operate in, and how minor changes can effect the rate at which trypsin digests the proteins in milk solution.
Bibliography
The only secondary source used to supplement work done in this investigation was the lower and upper fifth form standard biology textbook. Please note that this was used to devise a protein test, which did not work, and was subsequently removed from the procedure used to achieve results. Microsoft word was used to publish this document. No other secondary sources were used to supplement my investigation in any way.