Safety
To make the experiment safe we also employed a variety of safety measures such as:
- We placed a “stopper” at the end of the track so the cart would’t fly off and hit something or someone
- When kept the track clear of items and when the cart was in motion we kept all body parts (such as fingers and hair) away.
Improving our Experiment
To improve our experiment and its accuracy we could do a number of different things.
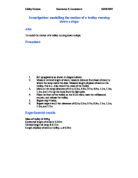
- Instead of using a stopwatch to time the cart, we could use light gate. By using light gates we would remove the chance of human error as all timing and recording would be done by a machine. If we used this setup the experiment diagram would look somewhat like this:
2.We could use a simple “gate” mechanism that when activated allows the cart to move onto the track, By doing this it would improve the accuracy of our experiment as it would stop the human error of us accidentally giving the cart extra force when we release it to go down the track.
Our Results
Possible outliers are highlighted.
I believe the two highlighted results are outliers as they are dramatically larger than the other results in their category, this may have happened due a human error, using the stopwatch (i.e missing the stop button or slow reflex’s)
Other Group’s Results
To improve the accuracy and variety of our findings we had multiple groups finding out the same thing but with the variable (length of ramp) being different. The Results are below. The Results are the average of the 5 repeats they did at each length of ramp.
Conclusion
After looking back at the data I have collected or others have collected I can conclude that the larger the distance the longer it takes for the cart to complete the track. The evidence supports my theory as all data collected shows a positive linear correlation.
Though the conclusion only stands if the data is reliable, In this case I believe it is for a number of reasons, for example we had multiple groups do each length multiple times and then worked out an average.
Although something that could disprove our theory is the spread of results. Each group results (in most cases) vary greatly than another groups, Why? This may because of a number of reasons which include human error and faulty equipment (Broken carts .etc), although something that may rectify the above situation is that although the results vary, the pattern they display doesn’t. They all show a linear positive correlation.
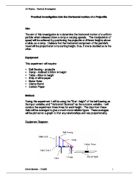
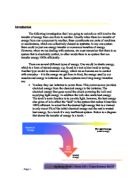
The Science
When we release the cart, The forces take over, The previous forces such as GPE are gone (as we release the cart) and are replaced with Kinetic energy. The Forces acting on the cart would look something like this (once we released it)
As you can see from the diagram above, both forces pushing up and down are unequal, This is because the cart is heading downwards, I.e the force pushing down is stronger than the force pushing up resulting in the object falling in height (in this case going down the track). The kinetic energy arrow is also bigger then the friction arrow, this is because the cart is accelerating at a constant rate.