Results
Table 1: the resistivity of nichrome wire at 32 gauge and 1 metre length.
Table 2: the resistivity of nichrome wire at 28 gauge and 0.5 metre length
Sample Calculations
Resistance (Ω)
The resistance was measured using the currents and voltages measured during the experiment. The formula for resistance is:
R = resistance
V = voltage
I = current
R = V
I
R = 1.92
0.11
R = 17.45 Ω
Resistivity (Ωm)
The electrical resistivity of an element is the measure indicating how strongly a material opposes the flow of electric current. A low resistivity indicates a material that readily allows the movement of electrical charge.
ρ = resistivity
R = resistance
A = cross-sectional area
l = length
ρ = RA
l
ρ = 17.45* 5.8965 x 10-8
1
ρ = 1.0292 x 10⁻⁶ Ωm
Resistivity as calculated from the graph:
ρ = RA
l
ρ = 17.213 x 5.8965 x 10-8
l
ρ = 1.01496 x 10⁻⁶ Ωm for the 32 gauge
ρ = RA
l
ρ = 5.0434 x 1.1104 x 10-7
0.5
ρ = 1.12 x 10⁻⁶ Ωm for the 28 gauge
Uncertainty
The Heisenberg uncertainty principle states that one cannot assign, with full precision, values for certain pairs of observable variables. This would also apply to this investigation where we have uncertainties to the readings taken. All readings would have these uncertainties above and below the reading.
To find the percentage uncertainty we apply the following formula.
% uncertainty = uncertainty x 100
reading taken
The uncertainties of the apparatus are shown below. This can play a major role in any errors or anomalies found.
Metre Ruler •+0.0005m
Voltmeter •+0.01volts
Ammeter •+0.01amps
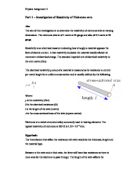
Metre Ruler
The ruler was used to measure the length of the wire. The end of the wire was held at zero centimetres and the other end was measured and cut.
% uncertainty =•+0.0005 x 100
1
= •+0.1 %
Voltmeter
The voltmeter was used to measure the voltage of the wire connected to this circuit.
32 Gauge 28 Gauge
Ammeter
The ammeter recorded the current of the circuit with the wire connected to it.
32 Gauge 28 Gauge
Resistance
Thus, as the resistance is calculated using the voltage and current obtained, we have the following resistance percentage uncertainties.
32 Gauge
28 Gauge
Resistivity
This is calculated using the resistance, area and the length. The uncertainties of the resistance and length are used to calculate the uncertainty of the resistivity. The area was not used as it was found by using the gauge value and checked against a referenced site, where diameters were published. As this value was given, the uncertainty was not counted as the method of measurement was not stated.
32 Gauge 28 Gauge
Discussion
As the investigation took place, the voltage was increased slowly. This increased the current passing through the circuit. From these values obtained for each of the wires, the resistance and resistivity were calculated. The resistance was calculated from both the values obtained from the experiments and also from the gradient of the graph drawn. This was done so that separate set of resistivities can be obtained and evaluated.
As seen from the calculations of the resistance, it is proportional to the length of the wire. The longer the nichrome wire is, the larger the resistance will be. This was certainly the case here as the resistance for the 1 metre wire was more than double that of the 0.5 metre wire. This larger resistance would be due to the cross-sectional area of the wires. Were the 1 metre wire had a cross-sectional area of 5.9 x 10⁻⁸ m2, the 0.5 metre was 1.1 x 10⁻⁷ m2, therefore the first nichrome being longer and thinner, causes the resistance to be much larger.
The resistivity was calculated for each of the nichrome wires and was found to be very close to one another. The slight difference could be due to experimental errors.
The 32gauge wire had a much larger resistance, while being the longer wire and had the thinner cross-sectional area. Taking this all into consideration, the resistivity was calculated at varying voltages and the mean value was 1.0149 x 10⁻⁶ Ωm. The gradient from the graph is the resistance, this again was used to calculate a separate value of the resistivity, which was 1.01496 x 10⁻⁶ Ωm. This was done as the trend line of the graph was set to the intercept of zero, as when there is no power through the circuit there would be no voltage or current. This value is the same as the value found from the obtained tabulated results.
The calculated resistivities for the 28gauge gave similar values. Here the mean value from the obtained current and voltage was 1.095 x 10⁻⁶ Ωm, where as the resistivity calculated from the gradient of the graph was 1.12 x 10⁻⁶ Ωm. Although these values looking different they are of the standard form of negative 6, meaning they are very small numbers, and therefore this slight difference is minute. Again this resistivity for the 28 gauge in comparison to the resistivity for the 32 gauge is the same, where very small decimal places are slightly out.
This investigation led to determining a good value for the resistivity by using two wires of different dimensions. The accepted value for the resistivity of nichrome is 1.50 × 10⁻⁶ Ωm. This in ratio to the values obtained is as follows:
32 Gauge 1.0149 x 10⁻⁶ Ωm : 1.50 × 10⁻⁶ Ωm
0.6766 : 1
28 Gauge 1.095 x 10⁻⁶ Ωm : 1.50 × 10⁻⁶ Ωm
0.73 : 1
This shows that the values obtained are very close to that of the accepted value. To improve the accuracy of the results the experiment should be repeated. In doing so, some variables should be kept constant i.e. the length, gauge or temperature so that an average can be obtained.
Bibliography