Kinetic energy = ½mv²
The main aim of this investigation is to find the acceleration of the trolley as the height of the ramp is increased. Acceleration occurs if the velocity of an object changes.
Acceleration = change in velocity / time taken
Friction will also affect the speed of the trolley. Friction will be produced as the trolley rolls against the surface of the ramp. It will slow the trolley down and produce heat and sound.
In this experiment there will be dependent, independent and control variables. The independent variable will be the height of the ramp. The dependant variable will be the acceleration of the trolley as it will depend on the height of the ramp. The control variables are variables that I will keep constant so that it is a fair test. The control variables are the mass of the trolley, the surface of the ramp, and the same starting and end positions. All of these factors need to be kept constant so that the experiment is a fair test and to see if the speed of the trolley is affected by the height of the ramp and nothing else.
Preliminary work
I carried out a small scale experiment to see if the main investigation will give me suitable results to prove if the speed of the trolley is affected by the height of the ramp. I carried out 1 run for each height to get results that are expected.
The conclusion that I can draw from my preliminary work is that the acceleration of the trolley does increase as the height of the ramp is increased.
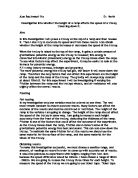
Apparatus: Trolley, ramp, computer, light gates, data logger, clamps, measuring ruler.
Method: The apparatus was collected and set up as shown in the diagram. The light gates were connected to the data logger and the data logger was connected to the computer. I used a computer programme to work out the acceleration of the trolley as it passed through the light gates. Light gates record the exact moment of the trolley passing through them. In my experiment 2 light gates were used to measure the acceleration from point A to B. For the light gates to sense any light change, a black card was stuck onto the trolley. As the light gates were connected to the computer, the readings taken by the light gates were transferred to the computer and it worked out the acceleration. Once the apparatus was set up as shown in the diagram, I rolled the trolley down the ramp 5 times for each height and then increased the height of the ramp by 5cm every time up. I did this until I had 30 readings in total. Accuracy was ensured by using a computer. The computer worked out the acceleration of the trolley from point A to B, which reduced the chance of human error.
Predictions: Based on the preliminary work I predict that the acceleration of the trolley will increase when the gradient of the ramp is increased.
Risks: There aren’t any major risks in carrying out this experiment but a few precautions need to be taken such as making sure that there is no one near the end of the ramp because the trolley might hit them.
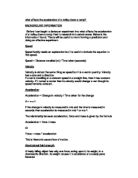
Results:
The results table above shows the acceleration of the trolley at each height. The averages of the 5 readings for each height have been calculated to find one value for each height so that they can be plotted on a graph. My results are reliable because I ensured a fair test by rolling the trolley down the ramp from the same point and without applying any force so that the acceleration was only affected by the height of the ramp.
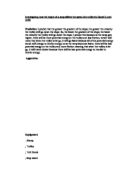
The graph above shows the average acceleration at each height. It is clear from the graph and the line of best fit that the acceleration is increasing as the height of the ramp is increased. The equation of the line of best fit tells us that for every 1cm, the acceleration is increasing by approximately 0.054 m/s².
The results show that my prediction was right and that the acceleration of the trolley down a ramp increases as the height of the ramp is increased.
Evaluation:
The experiment was done quite well and the results gathered were accurate and repeatable. The accuracy of the acceleration should be very accurate as it was done by a computer but the height of the ramp was measured and set up by me so the accuracy of the heights may be a little varied as it was done by a human but the results are still very accurate. I did not have any anomalous results probably because the trolley was rolled down the ramp from exactly the same point and the computer didn’t make any errors. The experiment could have been improved by using more accurate measuring instruments and reducing the chance of human error. The experiment could have been extended if I carried out more runs for one height to find a more accurate average and also I could have tested more heights to see if the trend is the same.