The object I will use for my trial experiment will be a marble and the slope will be held up by a clamp and stand. Also I will use a barrier at the end of the run-off distance to help me know when it has reached the end.
What the trial experiment told me
After the first seven results I recorded I decided that the run-off distance was too short for the results to be accurate so I lengthened it to 150cm. This is the length of the distance I will use for my final experiment. I decided that the range of heights I should use is 10cm-50cm going up in 5cm as I think that the results I recorded for 5cm weren’t accurate because it slowed down too much and 2cm didn’t even complete the run-off distance. I will keep the ways I made sure the marble rolled in a straight line the same because I think it worked. I will also carry on using a marble for my final experiment and set the rest of the apparatus up in the same way I did in the trial experiment.
Apparatus
Drainpipe cut in half (slope), marble, stopwatch, 3 metre-rules, 2 50cm rulers, clamp and stands, barrier.
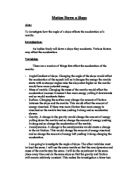
Diagram
Method
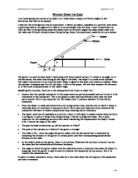
We will set up the experiment as shown in the diagram above. We will roll a marble down the slope and start the stopwatch once it leaves the end of the slope. The run-off distance is 150cm or 1.5m as from our trial experiment we decided that this would give us the most accurate results, any longer and the marble would slow down too much, any shorter and human error will effect the results too much. We will stop timing once the marble hits the barrier. We will do this five times, recording the time taken for the marble to travel the run-off distance each time, then work out the average time.
We will repeat this for each height we use, 10cm, 15cm, 20cm, 25cm, 30cm, 35cm, 40cm, 45cm and 50cm, We will measure these heights from the ground with a ruler attached to a second clamp on the stand. Once we have all the results and average times we will use our knowledge that speed equals distance travelled over time taken to work out the average speed for the marble on the run-off distance. The reason that we do not measure the length of the slope and time how long the marble takes to travel down it is because we are trying to find out how fast the marble is going at the very bottom of the slope because this is when the marbles gravitational potential energy has all been converted into kinetic energy or heat and it is at its fastest.
Here are the theoretically perfect speeds for each height using the formula made in my prediction. All the calculations are rounded to two decimal places.
50cm/0.5m v=√20h
=√(20*0.5)
=√1000
=3.16m/s
45cm/0.45m v=√20h
=√(20*0.45)
=3.00m/s
40cm/0.4m v=√20h
=√(20*0.4)
=2.83m/s
35cm/0.35m v=√20h
=√(20*0.35)
=2.65m/s
30cm/0.3m v=√20h
=√(20*0.3)
=2.45m/s
25cm/0.25m v=√20h
=√(20*0.25)
=2.24m/s
20cm/0.2m v=√20h
=√(20*0.2)
=2.00m/s
15cm/0.15m v=√20h
=√(20*0.15)
=1.73m/s
10cm/0.1m v=√20h
=√(20*0.1)
=1.41m/s
The speeds we record should be slightly lower due to friction
To keep the experiment accurate we will use a barrier to help us to know when the marble has reached the end of the run-off distance and eliminate as much human error as possible. To keep the marble rolling in a straight line we will use a drainpipe cut in half because it has raised walls. Every time we change the height of the slope we will also re-measure the length of the run-off distance because as the slope is raised the end of it gets further away from the barrier.
Fair Test
To make it as fair a test as possible I will use the same marble as the other marbles may have a different mass which will give them more gravitational potential energy and more kinetic energy, making them faster than a lighter marble. Also I will use the same length slope as if it is a longer slope, although it won’t have more gravitational potential energy than a shorter slope, it will be in contact with the slope more which means it will be affected by friction more and slow down. I will also keep the length of the slope the same because altering the length of the slope can seriously alter the accuracy of the experiment and it is important to do each run with the same degree of accuracy.
Results
Calculations
I will work out the average time for each slope height by adding them together and dividing by five. Then I will work out the average speed for the run-off distance by using the formula speed is equal to distance divided by time, the distance being the run-of distance and the time being the average time taken to complete the run-off distance for each height. All the speeds are correct to two decimal places.
0.5m av. Time=(0.53+0.53+0.54+0.53+0.53)/5
=0.532secs
Speed=1.5/0.532
=2.82m/s
0.45m av. Time=(0.55+0.57+0.54+0.57+0.55)/5
=0.556secs
Speed=1.5/0.556
=2.70m/s
0.4m av. Time=(0.57+0.56+0.62+0.6+0.56)/5
=0.582secs
Speed=1.5/0.582
=2.58m/s
0.35 av. Time=(0.64+0.65+0.67+0.65+0.64)/5
=0.65secs
Speed=1.5/0.65
=2.31m/s
0.3m av. Time=(0.68+0.72+0.66+0.72+0.68)/5
=0.692secs
Speed=1.5/0.692
=2.17m/s
0.25 av. Time=(0.83+0.78+0.85+0.88+0.78)/5
=0.824secs
Speed=1.5/0.824
=1.82m/s
0.2m av. Time=(0.97+0.9+1.03+0.9+1)/5
=0.96secs
Speed=1.5/0.96
=1.56m/s
0.15m av. Time=(1.2+1.15+1.2+1.21+1.19)/5
=1.19secs
Speed=1.5/1.19
=1.26m/s
0.1m av. Time=(1.4+1.43+1.44+1.45+1.44)/5
=1.432secs
Speed=1.5/1.432
=1.05m/s
2nd Experiment Apparatus
Ramp, trolley, card, light gate, 5 metre rules, timer
2nd Experiment Method
First we cut a piece of card 10cm in length and stuck it to the top of the trolley so that it was upright. Because to use the light gate we had to use a trolley, we also had to change the drainpipe to a ramp, which we propped up with books till it was the right height. To keep the trolley going in a straight line we stuck 4 metre rules, one on each side, down to the ramp just wide enough for the trolley to fit down. Over the bottom of the ramp we hung the light gate, which was connected to a timer. We let the trolley go at the top of the ramp and as I passed under the light gate the 10cm long piece of card broke the gate, which started the timer. When the card passed all the way through the light gate, the light gate joined again and stopped the timer. We didn’t do this a set number of times for each height, the number of times depended on the results we were getting. We also used different heights than in the first experiment. From the times we recorded we can work out the average time for each height and use the formula speed is equal to distance divided by time to work out the speed of the trolley at the bottom of the ramp, the distance being the length of the card, 10cm, and the time being the time taken for it to pass through the light gate.
The purpose of doing this is because the light gate removes a lot of the human error that comes with using a stopwatch. But still, to keep the results accurate we have to try and release the trolley as straight as possible, otherwise it will ouch the rulers there to keep it rolling straight and this will add to the friction a lot.
Results
The maximum speeds are all rounded to 3 decimal places.
Conclusion (1st and 2nd experiments)
The prediction I made about the results was correct, the speed did increase with height and the average speeds I worked out for the different heights in the method were slightly higher than the ones recorded because of friction.
The other prediction I made was that the graphs plotting height against speed would have a curved line that gets steeper. Neither of the graphs for the two experiments showed this. The graph for the second experiment begins to show this but the line begins to plateau towards the end. I also said that the graphs plotting height against speed squared would roughly have a straight, diagonal line, showing that height is directly proportional to speed squared. Here, the first experiment graph seemed more accurate as the line more or less went diagonally across the graph. But the graph for the second experiment did not really show any relationship between height and speed at all. Towards the end of the graph it improved and became more diagonal, but before that it wasn’t consistent at all.
The prediction for my results was correct but I think that friction plays too big part for the graphs to show a relationship between height and speed.
Evaluation
The reason I drew the graphs was to show that there is a relationship between the height of the slope and the speed of the object when it reaches the bottom of the slope. I drew graphs plotting height against speed squared as well as height against speed to prove the formula I wrote in my prediction, that height is proportional to speed squared. Although my prediction that speed increases with height and that the actual results would be slightly lower than the ones I wrote in the method using the formula from my prediction, my graphs showed that my results were quite inaccurate.
I think that the run-off distance I used in the first experiment was just about right. Not too short for human error to make too much of a difference to the results and not too long for the marble to slow down and be too different from the speed it was travelling at the bottom of the slope. However it is still impossible to get the run-off distance exactly 1.5metres using only a couple of rulers and even if human error in the timing using a stopwatch only makes a small difference it still effects the results slightly. Also human error comes into measuring the slope heights and rolling the marble straight, because even with the curved walls to the slope we used, the marble still did not roll down it in a perfectly straight line. Also the run-off distance surface was a desk surface and was a lot rougher than the surface of the slope, this adds to friction and slows the marble down quicker.
Using the light gate for the second experiment should have made my results more accurate than in the first experiment but going by the graph the results were less accurate. I think that this is because the piece of card that was stuck on to the top of the trolley to break the light beam as the trolley passed underneath was not exactly 10cm long, which is the length we recorded it as and used for my calculations, and because 10cm is such a short distance a couple of millimetres will make a lot more difference than if you have a long distance. Also, because we had to use a trolley instead of a marble as the object, the method we used to get the object travelling in a straight line, putting rulers parallel to each other with a gap just wide enough for the trolley to fit through, was not as accurate as in the first experiment, when we used a slope with curved sides, because the trolley sometimes touched the rulers and this added to the friction and slowed it down.
The main thing that altered the accuracy of both experiments was friction, so, to improve my method I would try and remove friction as much as possible by using a lubricant on the slope. I would use the trolley and light gate again because with a few improvements to the method it would b a lot more accurate than using a run-off distance and stopwatch because it should remove a lot of human error. I think that there was a problem in the experiment I did with the light gate because of the accuracy of the length of the piece of card, so, this time, after I have cut the card I will measure its length again in case when it was cut out it got larger or smaller than 10cm. The length I re-measure it as is the length I will use for my calculations because this will make them more accurate. The other problem with the light gate was the method of keeping the trolley travelling in a straight line, we had to use two parallel rulers which the trolley kept hitting, adding friction and slowing it down. So as well as lubricating slope I would lubricate the rulers to reduce friction there. I would keep the rest of the apparatus the same.