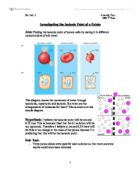
Raw Data Table:
Table 1: Shows the data collected for the potatoes in the 0.10 M solution (Glucose)
Table 2: Shows the data collected for the potatoes in the 0.15 M solution (Glucose)
Table 3: Shows the data collected for the potatoes in the 0.20 M solution (Glucose)
Table 4: Shows the data collected for the potatoes in the 0.25 M solution (Glucose)
Table 5: Shows the data collected for the potatoes in the 0.30 M solution (Glucose)
Qualitative Observations:
- The potatoes were hard and elongated except for the 0.30 M solution samples
- The samples in the 0.30 M solution had become soft and shorter.
- All the potato samples used had become brownish
- There was a sugary odour near the solution in the petri dish
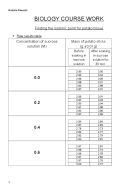
Processed Data
Table 6: Average Change in Mass, Average Change in Length for 0.1M
Table 7: Average Change in Mass, Average Change in Length for 0.15M
Table 8: Average Change in Mass, Average Change in Length for 0.20M
Table 9: Average Change in Mass, Average Change in Length for 0.25M
Table 10: Average Change in Mass, Average Change in Length for 0.30 M
Table 11: Shows the standard deviation values for the change in mass (g) (+/- 0.01 g) and length (cm) (+/- 0.05 cm)
Graph 1: Shows the average change in mass as the concentration of the solution increases.
Graph 2: Shows the Average Change in length as the concentration of the solution increases.
Conclusion:
Seen from the data above and the graphs illustrated, one can conclude that the isotonic point of potatoes is somewhere near 0.25 M. However, it is quite difficult to tell whether it is higher than 0.25M or lower, due to the disparity in the data. Graph 1 indicating change in mass, shows that the least change is for the 0.25M solution while the solutions with least change from the 0.25 M solution in the 0.30 M solution.
However, Graph 2, which illustrates the average change in length as the concentration of the solution changes, shows that the solution which had the second least change was the 0.2 M solution. This is contrary to the data shows in Graph 1. However, the solution to this is very simple. The changes in the 0.3 M solution are both negative i.e the length decreased. However the changes in the 0.20M and 0.25 M solution were both positive. This means that the isotonic point lies between 0.25M and 0.30M, but closer to 0.25 than 0.30.
However, to acknowledge anomalous data, as seen in Graph 2, an unusual trend appears. There is a sudden increase in the change in length of the potatoes in the 0.15 M solution. This is against the expected and regular pattern of data.
A general pattern that was observed in the data was that as the concentration increases till 0.25M the change decreases after which, the change becomes negative and increases from there on. This also shows that the isotonic point is somewhere between 0.25M and nearer to 0.25M.
Apart from this, the 0.1 M had the highest difference in mass and the second highest in change in length, where the highest was the 0.15M solution, which was a experimental anomaly. The general pattern of data suggested that as the concentration of the solution increased till 0.25M, the change in length and mass decreased, suggesting that it was nearer to the isotonic point than any of the other solutions.
The scientific reasoning is very simple for some the behaviour seen. Due to the higher concentration of certain solutions, more of the water would have flowed out of the potato OR, less of the water from the solution would have entered the potato through osmosis. Thus, higher the difference in the concentration of solute inside and outside the potato, larger the change in both mass and length due to a higher amount of water entering or exiting the potato through osmosis. Thus, closer the concentration of the solution to the solute concentration inside the potato, lesser the change in mass and length of the potato, and by using this logic, the conclusion was arrived at that the isotonic point of the potatoes was somewhere near 0.25 M.
Evaluation:
To begin with, there are many anomalies in the data collected during the course of the experiment. There are various possible causes/reasons for the disparity in the collected data. Firstly, the main anomaly in the data is the data collected for the change in length for the 0.15 M solution show in graph 2. It shows a sudden increase which is against the expected/logical pattern of data, as it should be lower than the change in length in the 0.1M solution.
One reason for this could be due to human error. The fact that I could have made a mistake while measuring the lengths of the potato chips after the experiment is very possible. This speculation is further strengthened by the fact that the parallax error can always occur while using analogue measuring tools, such as the ruler we used. This may have caused inaccurate readings to be taken.
Also, many inaccurate readings for the change in mass may have taken place due to inefficient drying of the potato chips, alot of the water might have been trapped within the potato when the mass was measured. This could have added extra mass when measured thus giving inaccurate readings.
The anomalous pattern shown in the change in length for the 0.10 and 0.15 M solutions could be attributed to human error. Due to this error while creating the solutions, the concentration that the solution that was assumed could have been completely different thus giving anomalous and incoherent readings.
The Standard Deviation values for all the data received are extremely low and thus indicate consistency within the results received from the experimentation. The highest stand deviation value is +/- 0.199 for the change in mass for sample 1, which is very low. This makes the data reliable with the exception for the anomalous pattern seen in the change in masses for the 0.15 M and 0.10 M samples, which is incoherent with the scientific explanation suggested.
The range of the increments for the concentration of the glucose solution proved to be appropriate as an accurate estimation of the isotonic point of the potatoes was suggested.
Whatever anomalous data received from the experimentation could be attributed to the uncertainties of the instruments used during the experiment as these could have caused inconsistencies and inaccuracies in the data received.
Suggested Improvements:
- To ensure accuracy in the lengths of the potato chips, use a more accurate cutting device which is easier to use and sharper so that the cut can be made easily and smoothly. Also, a more accurate measuring device should be used, for example, a vernier calliper.
- To ensure accurate mass readings, a more efficient drying process should be made as the mass of extra water on the surface may have affected the readings. Using acetyl alcohol as a drying agent may be a better option.
- Have prepared glucose solutions made by professionals to avoid inaccuracies in the specified concentration of the glucose solutions in use.
- Use a potato chipper to cut the potatoes into an even and similar shape to avoid inconsistencies in the surface areas of the potatoes used in the same sample as it would lead to different rates of diffusion leading to inaccuracies in the experimental data.