Apparatus
The apparatus we will be using in this experiment are:
Procedure
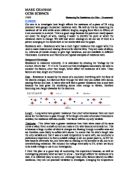
- The procedure of the experiment is to set up the apparatus in the diagram above.
- Next is to measure the length of wire you are going to use for the experiment. Either 10cm, 20cm30cm, 40cm, 50cm, 60cm, 70cm, 80cm, 90cm, 100cm with a range of 0 to 100cm.
- The resistors should be put on to full wire to stop the risk of heating.
- Turn the battery on and record the voltage and the current quickly then turn the battery off.
- Repeat this procedure using different lengths of wire.
- Then repeat it again another two times from number 2.
Fairness
- The connecting leads should be kept the same.
- The battery power should be kept the same.
- The resistance should be kept the same.
- The voltmeter should be kept the same.
- The ammeter should be kept the same.
This is all done so we can change only the length of wire so it will be a fair experiment.
- We need to keep heating to a minimum by using a variable resistor.
- The battery should be turned on and off quickly.
Accuracy
We need to keep all recordings to 2dp so we get accurate answers. We also need to repeat the experiment three times to find the average. We also need to put the best-fit lines on all graphs to show whether it is a curve or a straight line. The accuracy will be shown in our readings.
Background Knowledge
The resistors in a series circuit are shown because the more lamps you add the dimmer they get. The ammeter shows that the current gets less as you add more lamps. This means that the resistance of the circuit has increased. When we add resistors in series the total resistance goes up:
Rtotal = R1 + R2 + R3 etc
The resistance rises when electrons have too much objects to get through. One way the resistance raises is by heating which makes the wire atoms vibrate causing more of an obstacle to get through.
Ohm’s Law is for a given conductor at a constant temperature the current in its proportional to the applied voltage. We can write this as a formula I=V/R, we can use this formula to make calculations with all values of V for a given conductor. But we have to be careful, because the resistance might change if the conductor gets hot.
Prediction
From my theory and preliminary investigation I can predict that the bigger the length of wire, the resistance will be big therefore producing a lower current. As stated in my theory work, when resistors in a series circuit increase, the amount of objects in the wire increase therefore the resistance increases. It seems reasonable to suggest that the resistance and the length of wire on the graph will produce a steady line graph. According to all the information available, this will be the shape of the results graph. Initially the observations will show a straight line with a steady gradient.
Results
Conclusion
The resistance is affected by changing the length of wire because you keep increasing the number of atoms for the current to pass through. On the graph it shows the best-fit line going up at a steady rate. Using the knowledge that I have learnt in class, the more atoms for the elections to pass through making the resistance bigger. Also on the graph it shows one point that was a little bit far from the best-fit line, which was the 40cm of wire. It is shown in my results as well with one of the readings being 0.88V. My conclusion fits with the prediction that I made because the graph is increasing just as I said so. My prediction was that the bigger length of wire, the resistance would be big therefore producing a lower current. If I did this experiment again I would get the crocodile clips to stop sliding by putting grips between them. I would also get a better range if I repeated it more times. Another thing I would do is keeping the wire at the same temperature by keeping it in a cool room.
By
Leigh Clements
10A/Sc1