Equipment
- 1 metre ruler (2)
- A5 card
- Scissors
- Pencil
- Stopwatch
- Paperclips (0.43 grams each)
- Weighing scale
Variables
- Wing span
- Weight
- Height
- Wind
- Material
Weight
The weight was the independent variable so it changes for each experiment, the paperclips were 0.43g and we added one after we did three trials with the existing weight. The weight affects an experiment by increasing the time it takes for an object to hit the ground.
Height
The height was the control variable and it stayed the same otherwise the time taken would not be reliable as when the height increases so does the time taken for the spinner to fall and as the height decreases so does the time taken for the spinner to fall to the ground.
Wind
The wind can affect the time taken for the spinner to reach the ground, if there is more air pushing against it then it will take longer for it to reach the ground and if there is more air pushing down on the spinner then it would take a smaller amount of time to reach the ground.
Material
The material of the spinner makes a difference to the time taken for it to fall to the ground. If it is a tough material then it would fall faster because it would weigh more. If I used a different material for each spinner then this would mean that there is a factor that affects my experiment so my results will be less reliable and the results will vary. Some materials are not as strong and rigid as others, like paper is not as strong as card so this would also affect how fast the spinner falls and if different materials are used for different experiments then you cannot compare the results of different weights on the spinner as this would show unreliable results and you would make an incorrect conclusion.
Preliminary results
Results table
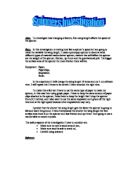
For the first experiment no weight was added to the spinner so the weight is 0 grams but the spinner did have a weight. Each paperclip weighed 0.43 grams each so the added weight increases by 0.43 when a paperclip is added. The ‘average time’ in the graph represents the time taken for the spinner to fall to the ground. The weight of spinner is the added weight of paperclips.
Result graph
Data analysis and interpretation of preliminary results
When the spinner is dropped from a height it starts to spin as it is dragged down to the ground by the force of gravity. The force of gravity when the spinner is stationary
The average results decrease almost steadily and slowly until the fourth paperclip is added with a maximum decrease in time of 10 seconds. There is a 0.31 second difference from the fourth to the fifth paperclip; this could be due to wind as the window was not closed. It could not have been because of the wing span, material or weight because we used the same spinner for all the experiments and the weight is the independent variable so it has to change and I do not believe it was easy to make mistakes with adding the weight. The only other explanation is that the height it was dropped from was different which is possible because I had to reach up to get the spinner to reach 2 metres. This could account for small changes that do not fit the trend, like the anomaly for the fifth paperclip. I believe that this was the reason and the trend for the first four weights were affected by the draft coming from the window as the wind can change from time to time increase and decrease like the results for the first four weights. Some are higher and others are lower from how they should be.
The time difference between the fifth and sixth weights is 0.06seconds which is the same amount by which the difference in time between the different weights were at for the lower weights. For the next two weights the time taken for the spinner to fall to the ground is longer but the same time taken for both weights, 1.17. This is probably due to the wind causing a resistance in the opposite direction to gravity slowing down the spinner and increasing the time taken to fall to the ground. The height that the spinner was dropped from could be higher than before so there is a longer distance to fall and so a longer time is taken. The average results decrease when there are nine paperclips added, to 0.89 which falls quicker than the spinner with 6 paperclips added, but still not as quickly as it should have fallen. The average for 10 paperclips added is higher than the one before which does not fit the trend because as the weight increases the time taken to fall to the ground should decrease and this has not been the case for half of the preliminary experiments.
The overall spread of data shows a very slight negative correlation, this means that as the weight increases the time taken to fall to the ground generally decreases. This is how the graph should be but the points should be closer to the line of best fit to prove that the results support the theory. My results do not really show strong support for the theory. As I am adding equal amounts of weight each time the results should go down in consecutive numbers and in my results it would be 0.09seconds as some are a bit below that amount and others are a bit higher so 0.09 is in-between. Then the line would be slightly steeper. The r squared value is not very good because the points do not fit the line of best fit closely. The graph shows that increasing the weight of the spinner allows the spinner to fall slightly quicker. This is visible from the line of best fit but the results do not support this theory very strongly because the points are not close to the trendline.
Revised Method
The method was slightly changed to prevent the problem of the spinner being dropped from different heights as the two 1m rulers put together was a height that was too high to reach easily so sometimes the spinner was dropped at a height higher or lower height than 2metres. Therefore one person stood on a table and dropped the spinner from the ceiling so that the height the spinner is dropped from cannot affect my results. The height from the ceiling to the ground was 3metres. Another factor that affected our experiment and was changed is the wind, we made sure that all the windows were shut so that they did not increase or decrease the speed that the spinner fell at and therefore change the time taken to fall. The rest of the experiment was the same as the preliminary. I used the same template as I did for the preliminary so that the wing span or the weight was not changed, because as the material changes so does the weight of the actual spinner. This means that I can compare both the results of my preliminary and revised experiment with each other and see whether keeping the factors under control actually improved my results.
I did not have to make the spinner again because the wing span and size of the spinner did not change from the preliminary experiment. The paperclip was weighed using a weighing scale that read correct to two decimal places, and pressed the ‘tare’ button to make the weight zero before weighing the paperclip to show the true weight of the paperclip. I attached a paperclip to the spinner and got on a table in order for me to drop the spinner from the ceiling which was a height of 3metres. The spinner was held up against the ceiling and dropped at a count of three and the person timing would start the stopwatch. When the spinner hit the ground the stopwatch was stopped. The result of three trials of each weight (paperclip) was recorded and the weight was then increased (by adding a paperclip). Using the stopwatch as a means of measuring the time taken for the spinner to fall was not very reliable but, all the factors that could be changed were. The way we timed was changed so that the accuracy was better, this was done by making the timer the person to drop the spinner so that the reaction rate is faster and the time taken to start and stop the stopwatch decreased.
Equipment
- Spinner made from A5 card
- Stopwatch
- Paperclips (0.43 grams each)
- 1metre rulers (3)
- Weighing scale
Revised results
Results table
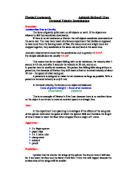
The weight refers to the weight added with paperclips and the average is the average time it takes for the spinner to hit the ground.
Results graph
Data analysis and interpretation of revised results
At a glance at the results table it is clear that the average time taken for the spinner to fall decreases as the weight increases but it does not decrease at a steady pace, this shows that even if the weight increases by a certain amount each time the time taken will not always decrease by a proportional amount. This may be
When there is no weight added to the spinner it takes the spinner approximately 2 .08 seconds to hit the ground. When the first paperclip is added the spinner falls to the ground 0.12 seconds quicker, this is because heavier object is the greater the force of gravity so it gets pulled down quicker and as the weights are added they should all fall faster to the ground as the weight added increases and the force of gravity gets bigger.
Even though the time taken reduces when the weight increases the amount it decreases by varies. It is expected that if the weight increases by 0.43 grams each time then the time taken to fall should decrease by a certain amount each time. My results show that the time taken to fall to the ground does not always decrease by a certain amount. When the second paperclip is added the time decreases by 0.11 seconds, which is almost the same and the graph shows a line falling steadily. Then for the third paperclip, it decreases by 0.03 seconds the steepness of the line on the graph has gone down by a large amount. Then it decreases by 0.15 seconds for the fourth paperclip which is around the amount it should decrease by and the steepness is almost the same as it was at the start. For the fifth paperclip it decreases by 0.13 seconds which is also a good result that is decreasing in time by the amount it should be.
Then for the sixth weight it decreases by 0.06 seconds and the steepness of the graph is reduced quite a bit. For the seventh paperclip the time taken reduces by almost the original amount. For the eighth paperclip the line would be a bit less steep and for the ninth paperclip the line would get very steep as it decreases by 0.19 seconds. And for the final paperclip it is 0.06 seconds so the line is much less steeper. When the spinner is dropped there is no added weight and the air resistance hits the large surface area of the spinners wing which causes it to slow down but as the weight starts to increase so does the force of gravity on the spinner so the force of gravity starts of getting stronger and stronger and when the last paperclip is added it is much stronger than the force of air resistance.
The small differences in time taken to fall to the ground are probably due to the time it takes for the person to hit the start and stop button on the stopwatch and the slightly large differences are because of the person dropping the spinner is not timing the fall, so if he timed the fall instead of the person watching then we can get results that have a smaller range.
The graph shows quite a line of best fit with the plots close to it which is why there is a good r squared value of 0.9934 and the graph shows a negative correlation between the weight increasing and the average time taken for the spinner to fall. Because the r squared value is also good this supports the correlation that my graph shows and the theory that as the weight increases, the time it takes for an object to fall to the ground decreases.