Osmosis. To investigate which sucrose concentration is the same as the concentration of cell sap inside the potato by narrowing down the primarily larger ranged concentrations of the cell sap
Science Coursework: Osmosis
Aim: To investigate which sucrose concentration is the same as the concentration of cell sap inside the potato by narrowing down the primarily larger ranged concentrations of the cell sap. We will do this testing an extensive variety of sucrose concentrations to discover the concentration that gives the smallest mass change in the potato.
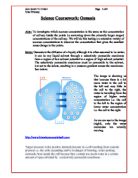
Intro: Osmosis is the diffusion of a liquid, although it is often assumed to be water; it can be any liquid solvent through a selectively permeable membrane from a region of low solvent potential to a region of high solvent potential. The selectively permeable membrane must be permeable to the solvent, but not to the solute, resulting in a pressure gradient across the membrane. See below:
The image is showing us that because there is a lot more water in the cell to the left and very little in the cell to the right, the water is travelling from the region of higher water concentration i.e. the cell to the left to the region of lower water concentration i.e. the cell to the right.
As we can see in the image (right), only the water molecules are actually moving.
http://www.himalayancrystalsalt.com
Turgor pressure is the positive internal pressure in a cell resulting from osmotic pressure i.e. the cells expanding and be in danger of bursting, water pushing outwards from inside the cell because they contain too much water in a certain amount of space divided by a selectively permeable membrane.
Flaccid is the complete opposite of turgid, in which case, very low solvent potential causes all the water in the solute to move across the selectively permeable membrane into the solvent which contains an extremely low amount of water.
This image (right) shows a plant cell in its turgid and flaccid state.
www.bbcbitesize.com
Plasmolysis occurs when a hypertonic environment causes plant cells to collapse due to an extreme depravation of water. This is caused by the water in the cell being drawn out into the extracellular solutes (fluids). The cell membrane pulls away from the cell wall, but the cell remains joined to the adjacent cells, this makes most of the cells surrounding it collapse aswell.
The following images show plant cells before and after Plasmolysis:
Before Plasmolysis: After Plasmolysis:
www.wikipedia.org
Osmotic potential is the hydrostatic pressure produced by a solution in a space differentiated by a selectively permeable membrane i.e. the likelihood that water will move across due to a difference in the concentrations of water. In this situation, the water flows into the substance (in this case a plant cell) because of the lower concentration of water inside. This results in the vacuoles in the plant cells to swell up and expand resulting in pressure on the cell from within and in turn being subject to turgor pressure.
A semi-permeable membrane is a division medium which allows only certain things through it and not others.
Prediction: We are using these five concentrations: 12, 14, 16, 18 and 20%. I have chosen these concentrations because 10%-20% was the range of results that changed in mass the least. We can see this from the preliminary results table at the end of the preliminary work below. This means that these concentrations are the most likely to contain the sucrose concentration that is the same as the concentration of cell sap inside the potato. I predict that if the ...
This is a preview of the whole essay
A semi-permeable membrane is a division medium which allows only certain things through it and not others.
Prediction: We are using these five concentrations: 12, 14, 16, 18 and 20%. I have chosen these concentrations because 10%-20% was the range of results that changed in mass the least. We can see this from the preliminary results table at the end of the preliminary work below. This means that these concentrations are the most likely to contain the sucrose concentration that is the same as the concentration of cell sap inside the potato. I predict that if the potato is placed in pure water then it will turn turgid and if the potato is placed in a strong sugar solution it will become flaccid. This is because outside the potato in pure water there is a very high water potential and inside a much lower one due to various other solute molecules in the potato e.g. sugar, salt, ions, etc. Therefore the water will naturally move against its concentration gradient into the potato making it swell up due to the fact that its vacuoles are now full of water. On the other hand, if the potato is placed in a strong sugar solution the opposite will happen - the water will move out of the potato across a huge concentration gradient (because although there is some water in the potato, there is hardly any in the strong sugar solution). After losing most of its water the potato will turn flaccid because there is noting in its vacuoles to support it or 'hold it up'. I predict that each of the concentrations will have similar results but I mainly expect the 14%-16% to deliver the results that I need. I think this because 10%-20% range went the closest to the results, I think the results I am looking for will be approximately halfway between the 10-20% range and this is 15% which comes under the 14%-16% range. These concentrations should be same as the concentration of cell sap inside the potato should be somewhere in the middle of these two concentrations. I think the 12% sucrose concentration ought to be a decrease in mass, whereas in the 14%-16% range of concentration, there should be an increase or equilibrium in mass. For the 18%-20% sucrose concentration range there should be a decrease because we are coming away from the halfway of the 10%-20% sucrose concentration range.
Fair Test: I have made this experiment a fair test because I have kept certain variables the same. I have used the same sized cork borer for all the potato chips to make sure all the chips are almost identical in size to keep this experiment a fair test. Aswell as that I have kept the temperature for each boiling tube the same so that higher temperature in any of the boiling tubes doesn't give it a faster rate of Osmosis. I have done this by keeping all the boiling tubes in a fume cupboard. The temperature was monitored to make sure that all the boiling tubes stayed at the same temperature maintaining this experiment as a fair test. In addition to that I have measured the mass of each potato using the same top pan balance to two decimal places so that none of the potato chips are measured inaccurately. To make sure our results were reliable we repeated this experiment three times in exactly the same conditions (temperature etc.) with exactly the same equipment.
Equipment:
* Five different concentrations of Sucrose solution: 12%, 14%, 16%, 18% and 20%.
* 2-3 Potatoes
* 6 Boiling Tubes
* 1 Boiling Tube rack
* 1 Measuring Cylinder
* 1 Graduated Pipette
* Top Pan Balance measuring to 2dp
* 1 Size 6 Cork Borer
* Ceramic Cutting Tile
* Small Cutting Knife (scalpel)
Safety: Scalpel: Be careful not to whirl around the scalpel as it could cause serious damage to yourself or people around you.
Boiling Tubes: Again be careful not to swing around boiling tubes as you could drop and break them creating serious hazard. Also hold boiling tubes firmly because if your grip is weak, the boiling tube can again fall out of your hand and break.
Cutting tile: Do not throw these around as their edges are quite sharp and can cause serious harm to the people around you.
Method:
. Cut six equally sized potato chips using the same cork borer.
2. Measure the mass of each potato chip using a top pan balance to two decimal places.
3. Measure and pour 25cm3 of sucrose solution into 6 boiling tubes. The five boiling tubes will contain these six concentrations of sucrose solutions: 12, 14, 16, 18 and 20 %.
Sucrose Concentration
(%)
Starting Mass
of Potato Chip
(g)
Average Final Mass
of Potato Chip
(g)
Average Change in Mass
of Potato Chip
(g)
Increase or decrease in Mass
2
.00
0.97
0.03
Decrease (-)
4
.00
.04
0.04
Increase (+)
6
.00
0.70
0.30
Decrease (-)
8
.00
0.82
0.18
Decrease (-)
20
.00
0.69
0.31
Decrease (-)
Results Table:
Sucrose Concentration
(%)
Starting Mass
Of Potato Chip (g)
Final Mass
Of Potato Chip (g)
Change in Mass
Of Potato Chip (g)
st test
2nd test
3rd test
st test
2nd test
3rd test
st test
2nd test
3rd test
12
.00
.00
.00
0.91
.00
.00
0.09
0.00
0.00
4
.00
.00
.00
.04
.02
.06
0.04
0.02
0.06
6
.00
.00
.00
0.64
0.73
0.73
0.36
0.27
0.27
8
.00
.00
.00
0.83
0.84
0.80
0.17
0.16
0.20
20
.00
.00
.00
0.74
0.82
0.52
0.30
0.1
0.48
Graph: This is a graph to show the increase and decrease in the mass of potato chips in correspondence to the concentration of sucrose which they are placed in.
Increase in
Mass (g)
Concentration of
Sucrose (%)
Decrease in
Mass (g)
Conclusion: There were two potatoes chips that increased in mass during the main experiment. The potato chips placed in the sucrose concentration of 14% were the only ones to increase in mass in all three tests; an average of this increase in mass is 0.04g. The potato chips placed in all the other sucrose concentrations however decreased in mass. Averages for each of these are: 12%: 0.03g, 16%: 0.30g, 18%: 0.18g, 20%: 0.31g.
The discrepancy of the mass of potato chips placed in different sucrose concentrations is due to the fact that all these concentrations have a different Osmotic Potential. Osmotic Potential is the likelihood that water will move across the selectively permeable due to a difference in the concentrations of water. If the concentration of water is higher in the solute (in this case the potato chip) than in the solvent (in this case the strong sugar solution) then the water; continuously trying to reach an equilibrium on both sides will try to 'balance itself out' either side of the selectively permeable membrane and almost all of it will end up moving into the solvent because there is hardly any water there and making the solute flaccid because there is very little water left in its vacuoles (the potato chip) to support it. This is known as 'hypotonic'. If, however the concentration of water is higher in the solvent (in this case the pure water) then he complete opposite will happen: the water will move across the selectively permeable membrane into the solute (the potato chip), filling its vacuoles and making it turgid. This is known as 'hypertonic'. This is precisely why the potato chips placed in the sucrose concentrations of 12%, 16%, 18% and 20% decreased in mass and became flaccid (some potato chips became more flaccid than others - this is shown by how much they decreased in mass in the results table above) and the potato chip placed in the sucrose concentration of 14% increased in mass and became slightly more turgid. Two of the potato chips only had a slight change in mass. These were: 12%: 0.03g and 14%: 0.04g.
My results supported my prediction because I predicted that the increase in mass would be in the 14%-16% sucrose concentration range and it was in 14%. I also predicted that the potato chips placed in 12%, 18% and 20% sucrose concentrations would experience a decrease in mass which they did (however large or small these decreases may be). One way that the results did not support my prediction was that I predicted that the 14%-16% sucrose concentration range would come closest to equalising the concentration of water between the solute and the solvent, but it was actually the 12%-14% sucrose concentration range that did so.
Evaluation: In our experiment we failed to keep the experiment conditions such as temperature the same due to lack of equipment. If we had better equipment, we would have been able to better maintain such conditions instead of trying to keep the temperature the same by placing them in a fume cupboard.
To make sure that the results we obtained were as reliable and as accurate as possible we took many initiatives. We used the exact same equipment for all three tests to make sure the results could not be flawed due to experiment conduction errors or miscalculation of the capacity of all the sucrose concentration etc. We did this by using a graduated pipette. Aswell as using the same size Cork Borer to make sure that the chips were cut precisely to 1cm we also used the same Top Pan Balance measuring to 2 d.p. so that the mass measurements taken were as reliable as possible. Aswell as that we again tried to keep the temperature for each boiling tube to prevent them having an unfair faster rate of Osmosis due to a higher temperature. Lastly we have repeated this experiment three times to increase reliability. Repetition of the experiment helped us make the results more reliable because if there were any anomalous results we would be able to spot them easily by looking at the three sets of results and noting down the major differences.
Preliminary Work
Preliminary Equipment:
Five different concentrations of Sucrose solution: 10, 20, 30, 40 and 50%.
* 2-3 Potatoes
* 6 Boiling Tubes
* 1 Boiling Tube rack
* 1 Measuring cylinder
* Top Pan Balance measuring to 2dp
* 1 Size 6 Cork Borer
* Ceramic Cutting Tile
* Small Cutting Knife (scalpel)
Preliminary Method:
. Cut six equally sized potato chips using the same cork borer.
2. Measure the mass of each potato chip using a top pan balance to two decimal places.
3. Measure and pour 25cm3 of sucrose solution into 6 boiling tubes. The six boiling tubes will contain these six concentrations of sucrose solutions: 0% i.e. pure/distilled water, 10, 20, 30, 40, 50%.
Preliminary Results: We discovered the following results after conducting this experiment.
Sucrose Concentration
(%)
Starting Mass
of potato chip
(g)
Final Mass
of potato chip
(g)
Change
in mass
(g)
Increase or decrease
in mass
0
1.00
1.43
0.43
Increase (+)
10
1.00
1.23
0.23
Increase (+)
20
1.00
0.82
-0.18
Decrease (-)
30
1.00
0.71
-0.29
Decrease (-)
40
1.00
0.60
- 0.40
Decrease (-)
50
1.00
0.44
-0.56
Decrease (-)
John Smith Yr.11/Sc1 Page 1 of 9
Miss Pittaway