To take the results we use a capillary tube with a tube and syringe attached to either end. Of course we will attach the syringe after we place the bung to the boiling tube with the plant in it, to avoid the build up of pressure in the syringe. Then after 10 minutes we will pull up the syringe, drawing up water and air bubbles. We will then measure these air bubbles and record the amount in centre metres.
I believe that the procedure that I have chosen will work extremely well and is very reliable. As I said above the only thing that is likely to affect this experiment will be human error.
Prediction
The factor I have chosen, Light Intensity, will really only have one outcome. I predict that the higher the light intensity the more oxygen will be produced. This isn’t really accurate though because there will be a point where the light intensity will not matter, at one point the plant will produce all the oxygen that is possible. After that the light intensity will no longer matter. The point of this experiment will be to find that point.
The reason I believe that the higher the light intensity the higher the amount of oxygen will be produced is because if there is a higher concentration of light on the plant the more light the plant will absorb through it’s leaves and therefore the more photosynthesis. In the leaves the chlorophyll and carotenoids will have to deal with much more light. They will convert more light into energy, which will obviously give the plant much more energy. This will result in more photosynthesis taking place, converting more CO2 into glucose and oxygen. At a certain point there will be to much light for the chloroplasts (chlorophyll and carontenoids) to handle and they will only convert a certain amount of light and no more will be converted. This also happens where the reaction takes place. In the Cytoplasm, when this reaches a certain point it to cannot make a chemical reaction to change the carbon dioxide and water, and so it stops and handles what it can.
This is my prediction for the results of the experiment.
Obtaining
Method
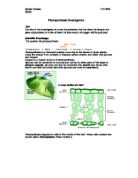
We set the experiment up as the diagram specifies. We then placed the light 60 cm away from the plants position. Then we placed the Sodium Bicarbonate into the water of the plant, 5 ml. Then we put the bung, with the tube and syringe in the top, and closed off the box. Then timed it for ten minutes. After this had been done we moved the light 20 cm closer and changed the water and sodium bicarbonate of the plant and started again. After that had been going for ten minutes we recorded the results and then moved the light another 20 cm closer. After this we placed the light next to the plant and took anther set of results after ten minutes. We also had a control experiment that was placed in the room light. We used the method of drawing the water up into the syringe to obtain the results as I have mentioned in the plan. At all times during this experiment we had to make sure at least two people were monitoring the experiment and one person monitoring the time elapsed for the result reasons and the safety factor.
Diagram
Results
Analysis
The results I have show a steady rise between each 20 cm rise. This is what I predicted would happen in my prediction. As I predicted the closer the light to the plant the more energy would be converted to make photosynthesis. This resulted in more oxygen being made as a by-product of the photosynthesis.
As I predicted the closer to the plant the more light is converted by the chlorophylls and Carotenoids. This means that there is a lot more light energy being converted into Carbon Dioxide and in turn more energy for photosynthesis. More photosynthesis means a lot more waste products, one of these is Oxygen. The more oxygen there is the bigger the air bubbles and the therefore we could measure them.
As the graph shows there is a steady rise in the amount of oxygen bubbles produced as we increased the light intensity. The graph is pretty much a straight line and it shows that there is an easy conclusion because the graph is so conclusive about the rise in the amount of oxygen being produced as photosynthesis takes place. So It does give us a good conclusion and the graph shows this very well. This shows exactly what I thought that the higher the light intensity the more oxygen will be produced due the higher energy being supplied for the photosynthesis to take place. I also believe that there could be investigation to be done between the two points on the graph. I believe if we were to investigate with more precision of distance between these points we could find the point where the chloroplasts stop absorbing light. I also believe that the plant not being able to handle any more chemical reaction could cause this but I would have to investigate this further. This results in a sudden stop of increase in the amount of photosynthesis taking place at any one point at a time.
I predict that if I were to do this experiment in further detail and concentrate at a certain point that I could in fact come up with some evidence to the theories I have mentioned above.
At one point in the table there is a result that I didn’t add into the averages because I didn’t believe it corresponded with the other ones in the table. So I left it out, not to avoid confusion or a big change in the table.
Evaluation
Throughout this experiment the rest of my group and I have made every effort to keep the tests fair. Of course we cannot account for everything. The method we used above seemed sound in theory. When we tested this theory there was nothing wrong with the science around this theory but the human error was apparent.
The accuracy of our test was very good. It was as conclusive as we had hoped and there was only one out of place result. All of our tests were done very strictly and all of our results fit with each other so the only thing that we could have done to make it more accurate would be to use a computer. The only thing that can be pointed out about the lack of accuracy would be the human factor and we have had a lot of success with the experiment and I believe that the accuracy is very good.
The apparatus we used for the experiment had to be accurate. Each area had to be measured properly to get accurate results. To measure the light intensity we used the distance from the pond weed using a ruler, this gave us good results and was quite accurate. To get a better reading we could have used a light intensity metre. To measure the air bubbles we used a ruler as well, also because it was in a very thin visking tube, so the small air bubbles that are produced could be measured with a greater accuracy because we can see an increase in air bubbles that we wouldn’t be able to see if it was wider. This is also apparent in how we measured the Sodium Bicarbonate Solution, we used a thin flask to measure a more accurate amount of the solution. We also used a stop clock to measure the time elapsed. This wasn’t as accurate as the other measurements because of the time it took to turn off and then measure the air bubbles. There was at least a 2 second margin of error. If I was to improve this I would use a computer measuring device. Overall the experiment was very accurate and the apparatus used worked very well.
To keep the light intensity factor unaffected by any outside light we placed a box over the experiment. This box seemed ok but there was a small gap over under the box. This could mean the light could escape or be affected by the outside light.
The other possibilities with any mistakes being made during this experiment is that the people making some of them. This could have been done if someone misread the results or set something up wrong. These could explain some results that looked out of place.
With our experiment only one result seemed out of place. Of course in the result I have highlighted. The result stands out quite a lot. There is a 30 mm difference between the different results. This is probably simply down to human error. Someone may have misread the result that they had gotten off the tube. There could have been other explanations as well such as the amount of Sodium Bicarbonate could have been wrong or the test tube may not have been secured with a bung. All these could have been part of the problem with the experiment. I didn’t use this result in the graph or analysis. I have highlighted it and it will stay out of the final results.
If I were to improve this experiment I would use a dark room and then I would have measured the result using more scientific equipment. This would have been more scientific and less amateur. This would have most probably cut down on the mistakes.
If I were to do the experiment again I would have a smaller more designated area of results. This would be in the higher bracket of the table. This would be between the 20 cm away from the test and next to the test. This would give us an n idea of the highest point that this plant can absorb light intensity from. It would be a simple task of narrowing down the different lengths away from the test. This would give us a clearer perspective of how high the light intensity must be before it becomes in affective in the plant. To show this I have marked this area on the graph that I have drawn.