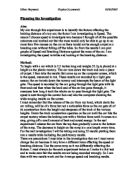
Stopping distance can be affected by many factors, the main ones being the speed the car is travelling at, the use of a mobile phone, drink-driving and wet weather.
- The thinking distance is always the same, no matter what speed the car is travelling at. But because more distance is covered over the same period of time when driving fast, the driver has less time to react to any hazards. Also, a small increase in speed will increase the braking distance: if the speed is double, the braking distance will be increased by four times.
- Using a hand-held mobile phone diverts much of the driver’s attention from the road, and so the thinking distance is increased greatly when using one.
- Alcohol and illegal drugs cause thinking time to be increased, because it takes the driver longer to process information. A drunk driver may also not press as hard on the brake as a sober driver. The extra time it takes the driver to press the brake, means that the car would be travelling at a faster speed when it hits the pedestrian, causing a more serious injury.
- When roads are wet, the car has less grip on the road surface, resulting in more skids and increased braking distances. Thinking distance can also be increased by reduced visibility due to rain. Also, if the tread depth of the tyres is low, the rubber has less grip on the road, and this is even more dangerous when driving in bad weather conditions.
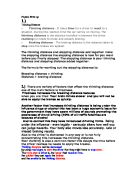
Stopping distance = thinking distance + braking distance
Thinking distance = speed x reaction time s=d/t
Thinking distance is affected by:
- Tiredness
- Alcohol
- Drugs
- Distractions
Tiredness, alcohol and drugs all make the mind think slower and take longer to process information
Braking distance is affected by:
- Speed
- Weight of the car
- Road conditions
- Braking efficiency
- Friction between road surface and tyres (good tread)
The more friction between the wheels and the road the less the braking distance.
The less aerodynamic the car, the more drag/air resistance, meaning that it slows down quicker than cars with good aerodynamics.
Although the heavier the mass of and in the vehicle, the more momentum it gains, and so it will have more kinetic energy, meaning the braking distance is increased.
Jake’s conclusion was correct: he said that the time it takes to brake depends on the speed of the car and other things.
It depends on the factors which effect thinking and braking distance (overall stopping distance.)
Reliability and Validity
The data is reliable because it is repeatable. The stopping distance test could be carried out using the same vehicle and get the same/very similar results.
However, because we don’t know when the stopping distances were calculated, we cannot not assess the validity of the data fully. Cars made 20 years ago would have had a much higher braking distance than a car made this year, due to advances in technology. However, I found that this chart could be found on the government website, which was updated this month. So the reason this data is used is because it is still relevant. I think that the government is a reliable source for data, and if the information/data was very out of date, I would expect it to have been updated. This factor adds to the reliability of the data.
The stopping distance table was published in 1946 in the third edition of the Highway Code. Although advances in road surfaces and breaking systems have been made, the stopping distance for a car actually remains the same, and so means the data is reliable. But because only a certain model of a Ford car was used in the table, it means the data is not valid for all cars.
Applications and Implications of Science
Why Publish the Data:
I think that it is important that stopping distances are published because it allows people to make the connection between speed and stopping distance. People who think that because they have quick reactions, they can drive fast and still avoid collisions, are proved wrong. Or those who have cars with exceptionally good brakes are shown that thinking distance plays a big part in the overall stopping distance. This data would hopefully make drivers think more carefully about the speed they are travelling at.
Consequences of driving too fast:
Driving above the speed limit in built up areas or driving at speed could result in hitting a pedestrian, especially children playing, a fine, points on your licence, and hitting another vehicle. In bad weather conditions, skidding becomes more likely, resulting in a collision with structures, vehicles and people. Driving at speed increases the thinking and stopping distances, meaning that the driver has less time to break before hitting something etc. Also, in built up areas, there are often many distractions, and these would increase the thinking distance of the driver.
Mass x velocity = momentum
A bigger vehicle (e.g. 4x4) will have a bigger stopping distance because it gains more momentum through kinetic energy, and so the driver may well have the same reaction time as a car driver (Mini), the braking distance will be increased, therefore taking longer to stop.
The only reason why stopping distances should not have been published, is because it could encourage some drivers to try and disprove the data. Although this would be a very irresponsible thing to do, there are some people, usually teenagers, who would risk such dangerous actions.
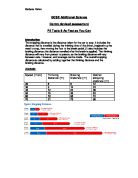
However, many people are more vigilant when driving faster, e.g. on motorways, than when driving on A roads:
We can see that there are more serious injuries and deaths by drunk drivers on urban and rural roads than motorways. This is likely to be because when driving on a motorway, people tend to take more care and are more sensible.