Method
There are numerous methods to measure the speed of the ball as it travels from the ramp and onto the carpet. These are the two methods that I have used during the Preliminary in order to test out which is better, and why. The following table lists both its advantages and disadvantages, of the methods, and also have brief description about each one.
The table below lists the advantages and disadvantages of possible methods, and describes how they are to be carried out.
As a result of this analysis of the methods, I decided to use the more proven and more accurate and reliable method, the Light-Gate. This is because it will be easier to record, less hassle, more time to work on the experiment as it will be very quick and easy to do, and will be easier create graphs and tables, and make conclusions from the data as it will be easier to spot any trends.
The Equipment Needed.
- Light-gate device
- Computer/Laptop (preferably a Laptop)
- Ramp
- Clamp x2
- Clamp Stand x2
- Metre Stick(s) (depends on how far the stopping distance is)
- Carpet (depends on results of Preliminary)
- Ball (also depends on results of Preliminary)
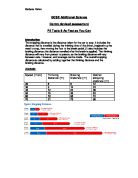
Here is a diagram of how it should look:
Step-by-step Method
- Connect the clamp to the clamp-stand.
- Mark out regular-distance intervals along the ramp, using the metre-stick as a guide.
- Connect the ramp to the clamp, at a certain height along the stand.
- Lay the chosen carpet on the table, smoothing out any bumps.
- Position the ramp on the carpet, so that the two overlap each other at the edges.
- Connect the light-gate to the laptop.
- Place the connected light-gate in front of where the ramp overlaps the carpet.
- Place the metre-sticks horizontally along the carpet, placing the ‘0cm’ mark at the point where the ramp light gate is.
- Position the chosen ball(s) at a certain distance along the ramp (at the appropriate distance-interval)
- Release the ball, letting it travel down the ramp and onto the carpet.
- Ensure the light-gate is recording the speed of the ball.
- Measure the stopping distance of the ball on the carpet using the metre-stick. (Use a second metre-stick if the stopping distance exceeded 100cm.) (place the metre stick along the carpet aligned to the light gate)
- Repeat ‘Steps 11 to 13’ five times, re-setting the light-gate before each further trial.
- Repeat steps ’10 to 14’ for each distance-interval along the ramp. (All distance-intervals need to have a trial and five further repeats before continuing on to Step 16.
Safety Procedures
- The Apparatus shouldn’t be ANY WHERE near the Computer or Laptop, as the rolling ball might causes damage to it
- Clear out the space that you are using from anything, from bags to books.
- No water anywhere, in fear of damage to equipment (laptops, Light gate etc.)
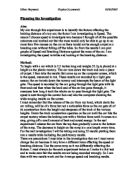
Preliminary
Before even doing the real experiment, we needed to make sure what equipment we were going to use in the real experiment, and so we decided to test out the equipment and to familiarize myself with the equipment to then use in the investigation. E.g. Using the Laptop correctly, prevent mistakes to happen in the real investigation. As well as that I need to ensure that the equipment that I’ll be using in the investigation will be the most accurate and most reliable ones.
Instead of just the equipment, I will be also testing out the:
- Type of ball (golf, marble, small silver, etc.)
- Type of Carpet
- Ramp heights
This I will be testing on as, I will need to know which will produce a good batch of reliable results, from which a “Speed against stopping distance” graph could be drawn from.
The reason why I’ll be testing the different ramp heights is that in order to get the best results, I will need to know what height the ramp should be as, if too high then the ball will travel too quickly/far, and vice versa. This is because the greater the height of the ramp, the greater the GPE and therefore its Kinetic Energy.
The reason why I’ll be testing different types of carpet, as I’ll need to find out which carpet will be the best one to use, as I’ll need a carpet that allows the ball to travel a good distance on the carpet before stopping. But a bad carpet will allow the ball to go too fast/slow.
Preliminary Results
Choosing which ball to use:
Small metal ball Rolled of the Carpet
Medium metal ball Stopped in the carpet – went straight
Golf ball Curved a little on the carpet
Squash ball Curved a lot
From these results, we decided to use the medium metal ball as it was the only ball that went straight.
Choosing which method to use:
Firstly, we carried out a test using the stopwatch method as a way to measure the speed of the ball; we also changed the height of the ramp to increase/decrease the speed of the ball. After numerous trials, we relised that moving the ramp up and down was harder, more time-consuming and was less accurate. Using the stopwatch to workout the speed was also a very long process as we had to work out the time taken
Based on the results from the Preliminary, we chose to use:
- The golf ball and the marble (to compare with each other in graphs)
- The light gate method
- Height of 15cm of the ramp
- The orange carpet
- Drop the ball from different points on the ramp from 10cm-90cm (this was good range as we needed a good range of results in the graph)
Results Table
MARBLE RESULTS
GOLF BALL RESULTS
Analysis
In this experiment, I am investigating the effect of a ball’s speed on its breaking distance. But in we need to be able to understand what is going on as the ball is released from the ramp and when it stops. I will try to explain this scientifically.
Evaluation
Although I managed to obtain a good set of results from carrying out the experiment, there were several difficulties in trying to collect valid and reliable data. The following table describes the problems I encountered while carrying out the experiment, and suggestions on how I would improve the experiment if I had to repeat it.
Confidence on the Conclusion
On the whole, I am quite confident with my conclusion. I attained a set of results which strongly suggested that speed of the ball had the effect on the ball’s breaking distance. Although, as most of the graphs show, many of the range bars are a bit large, meaning that the results are not very reliable as there is a large scatter of data, perhaps this was because of the ramp bent as the ball rolled on or that the light gate wasn’t positioned correctly at that time, justifying the reason why its results was so scattered.
Throughout the experiment, I had obtained many outliers in my results, as shown by the 2 Tables. These may have occurred because of any of the following reasons:
- On some repeats, the position of the light gate wasn’t in the same place as other repeats or therefore making
Despite these outliers, the majority of the averages were close to or on the curve of best fit, so after eliminating outliers, the results were reliable on the whole.