When the water potential in the salt solution is low (i.e. it is more concentrated than inside the potato cells), the water will move out of the potato cells down its concentration gradient to reach equilibrium with the salt solution. When this happens, the cell will reduce in size and become flaccid. This is what leads to a decrease in mass.
METHOD: In my experiment, I will vary the concentration of the salt solution I use. I will measure the change in mass of the potato pieces after 3 hours, and the percentage mass change. For my experiment, I shall require the following apparatus:
- 1 large potato
- A sufficient amount of 0.5 mole salt solution
- Distilled Water
- Measuring Cylinder
- 6 Boiling tubes
- Boiling tube rack
- Labels
- Potato corer
- Scalpel
- Ruler
- White tile
- Glass rod
- Electronic balance (2DP)
- Cling-film
I shall use six different concentrations of salt solution, as six are needed for drawing a good line of best fit on graphs. I will get my six different concentrations by mixing the salt solution with distilled water in the following ratios:
I shall take 2 repeats to ensure that my results are accurate. Due to time constrictions, I will get my repeats by using other people’s results. Using my repeats, I shall find percentage change and the mean percentage change. Fair testing shall be ensured in the following ways.
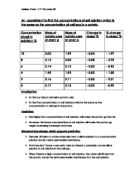
Preliminary Work: The following preliminary work helping me in my plan by telling me 2 things:
1 In distilled water, the potato is gaining mass, while in the 0.5 molar salt solution it is losing mass. This means that the point at which no mass change occurs, must be between these two, making this a good range of concentration to use.
2 Mass change continues for some hours but slows down after around 3 hours and in the case of the salt solution actually reverses. This means that the optimum time to leave the potato before reweighing is 3 hours.
Potato cylinders were placed in distilled water and in 0.5 molar salt solution and reweighed at intervals:
PROCESS: Using the corer and scalpel, on the white tile, cut out 6 roughly equally sized pieces of potato, preferably from the same potato. If needed, use the glass rod to remove the potato from the corer. Weigh and record the mass of each piece of potato. Measure out the correct concentrations of salt solution into the boiling tubes, using the measuring cylinder. Mark each boiling tube with the concentration of salt solution that it contains, using the labels. Put the potato pieces into the boiling tubes, and cover with cling-film to prevent evaporation. Leave for 3 hours. Remove the potato from the boiling tubes and dry any excess water. Reweigh each piece and record the mass changes. Use this to find the percentage change and to plot a graph.
RESULTS:
N.B. The % Differences highlighted in are anomalous and have been excluded from the Mean % Difference.
GRAPH:
ANALYSIS:
After completing my experiment, I have found that the concentration of salt solution that is equal to the concentration of the cell cytoplasm and cell sap of potato cells is 0.18 moles. This is shown on my graph, where the trend line crosses the x-axis at 0.18. This means that the concentration where there is no difference (i.e. equal to that of the potato sap) is 0.18.
These results mostly support my predictions. The masses of the potato pieces definitely change in different concentrations. The ones in higher concentrations did decrease in mass, whilst the ones in lower concentrations did increase in mass. My graph is also quite similar to the one I made in my predictions. As I predicted the graph is inversely proportional, although it is not a straight line graph but is curved.
EVALUATION:
I believe that my experiment was quite successful, as I only had three anomalous results. This means that my experiment must have been relatively accurate. The procedure used was suitable and successful. One thing that could be done to improve results would be to take repeats yourself, so as everything is done the same for all of the results.
The anomalous results are probably due to either inaccurate measuring or weighing, but could also be down to the fact that each set was taken by a different person, at different times. However as I only found three anomalous results, I believe that my evidence is strong enough to support my conclusion.
Further work that would provide additional evidence to support or disprove my conclusion would be to use more concentrations of salt solution. By this I mean use concentrations between 0.1 and 0.3, but at more regular intervals (e.g. 0.12, 0.13, 0.14 etc.). One problem with this, however, is that it is not possible to ensure that the concentrations are measured to this accuracy.