George Stokes
George Stokes' law of viscosity established the science of hydrodynamics. We most often run into him with the work he did on the settling of spheres, but he also derived various flow relationships ranging from wave mechanics to viscous resistance.
Stokes papers on the motion of incompressible fluids, the friction of fluids in motion, and the equilibrium and motion of elastic solids exemplifies his wide range of influence in physics. His works on the transmission of acoustic waves through viscous materials (like tar) are also of interest.
Stokes also investigated the wave theory of light, named and explained the phenomenon of fluorescence, and theorized an explanation of Fraunhofer lines in the solar spectrum. He suggested these were caused by atoms in the outer layers of the Sun absorbing certain wavelengths. However when Kirchhoff later published this explanation Stokes disclaimed any prior discovery.
In short Stokes was an all-around wiz kid (whose name we can pronounce). (If you know of any good stories about George email them here). Stokes came up with a formula that can predict the rate at which a sphere falls through a viscous gas or liquid. He was the first to understand why a mouse can fall 1000 feet and walk away yet a man would be dead.
Stoke’s great Law of Drag
If
r = the radius of a sphere in cm
d1 = the density of the sphere in g/cm3
d2 = the density of the fluid in g/cm3
g = the local gravitational acceleration in cm/S2
c = the Viscosity of the fluid in Poise
v = the terminal velocity in cm/S
Then
v = 2r2g(d1-d2)/9c
This velocity is the terminal or ultimate velocity the sphere will attain falling through the liquid or gas in question. Thus approximating a mouse and man’s body as a sphere, and assuming that we have a radius 5 times that of a mouse – the terminal velocity of a man (about 100 mi/hr) would be 25 times that of a mouse!
Dropping a sphere of known size and mass in a liquid and measuring its terminal speed is one way to measure viscosity. This method gives an enormous range of measurements; the largest to smallest readings give us a ration of about a billion to one. Noting the temperature is most important when taking such a measurement because of the great change even a small change in temperature can cause. Caster oil can change its viscosity about 8% per degree c!
The equations covered so far work as long as the motion is slow enough to keep the flows in the laminar domain. Once the speeds increase past a limit the drags grow at enormous rates. Sometimes it is necessary to figure out if the dominant variable is the viscous flow or inertial flow.
Osborne Reynolds Aug 23, 1842 - Feb 21, 1912
There is no way to do justice in describing Reynolds work; that would require a book. He was not just a scientist, but also the prototype of the modern engineer. In his work can be seen the rigorous error checking that set the standards for later workers. Although Reynolds is best known for his number, few fields of science and engineering are not touched with his life’s work. From discharge tubes, to bearings, to thermodynamics, to cavitation, to magnetism, and electricity; he left his mark. (Yet, this is but a part of what he did!) This Irish Brit -- Osborne Reynolds -- came up with a unit that like the Mach number is dimensionless. When the Reynolds number (abbreviated Re) is properly calculated all units cancel out.
Reynolds Number (Re)
IF
s = speed of the fluid in cm/s
r = the radius of the tube or a sphere in cm
d = the fluids density
vd = dynamic viscosity in Poise (dyne-seconds per cm2) dyne = gcm/s2
vk = Kinetic in Stokes (vd /d)
Re = Reynolds number
THEN
Re = 2r d s/ vd cm cm g s2 cm2 / g cm s s cm3 (all units cancel out)
Or because stokes = vd /d
Re = 2rs/ vk
Well what does a Reynolds number mean?
Small Reynolds numbers mean that the fluid's viscosity is dominant. On the other hand when Re is larger than 10,000 it means that viscosity is negligible and the kinetic or inertial effects rule.
When Re is high, turbulence, cavitations, and chaos describe the flow. When Re is low, laminar flow dominates and drag is approximately equal to speed X size X dynamic viscosity giving a linear rise in drag with speed (and a squaring of power with speed).
On the other hand, when Re is large drag is approximately equal to Speed2 X Size2 X density! This means that once the Reynolds number is large, drag goes up with the square of speed and power goes up with the cube of the speed!
Introduction
When dealing with fluid/mechanical systems, it is important to know what affects the rate of descent of an object through a liquid.
There are many factors that affect the descent of an object through a liquid such as:
1) Temperature of the liquid
2) Mass* of object
3) Size/surface area of object
4 Viscosity of liquid
5) Angle of descent
Temperature
I would like to investigate the correlation between temperature and time of descent. Reading suggests that the colder the liquid the longer it will take for the object to reach the bottom.
Mass*& Surface area/size
Gravity accelerates at 9.81 ms-1 independent of mass. Hence increasing the mass will not affect the experiment of surface area. Thus using an object of various sizes it would be possible to investigate the proportionately of size on the descent of the object.
Viscosity
I feel it is important to investigate the affects of how a more viscous liquid would impede the progress of an object descending through a liquid. Therefore I have included this factor into my investigation.
Angle of descent
I would like to observe the affects of the object descending at an angle. Such at sediment in a bottle is there a way in which bottles should be stored that may hasten descent?
Aim
To investigate the rate of decent of an object falling through a liquid (simulated by a ball bearing) and investigate some of the factors that will affect this.
Summary
I have completed this investigation by using many simple experiments to reach a firm conclusion on the rate of decent of a ball bearing through a liquid.
Size/surface area of ball bearing
The first set of experiments was to show the speed of five differently sized ball bearings descending through water. All five ball bearings seemed to reach their terminal velocity at the same timed interval.
Viscosity of liquid
The second set of experiments was to show the affects of a more viscous liquid (engine oil) on the decent of a ball bearing. Using the same method as the experiment for surface area, the ball bearing took longer to descend through the liquid.
Temperature
On the third experiment I varied the temperature of the oil. The difference was at a higher temperature the ball bearing descended faster through the liquid.
Angle of descent
Finally the fourth experiment compared angles of which the ball bearing descended through a liquid. The results showed a greater angle to the vertical reduced the speed of decent through the liquid.
Initial apparatus
The following apparatus was used to complete the investigation:
2.2 metre plastic tube (colourless)
Diameter 0.03 metre
900ml Water
900ml Engine oil
Five ball bearings with diameter and masses as follows:
Class Mass (g) Diameter (mm)
Very small 0.12 2.96
Small 0.88 6.98
Medium 4.07 9.98
Large 8.96 13.98
Very large 16.69 16.9
Clamp and clamp stand.
Tape measure
Stop clock
Tray
Bung
Magnet
Bunsen to heat oil (in a pan).
Note:
Each experiment shall be repeated 3 times and an average calculated to plot a graph.
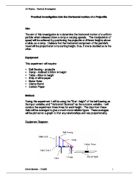
Practical investigation into Viscosity in liquids(Stokes Law)
From www.essaybank.co.uk
Introduction
When dealing with fluid/mechanical systems, it is important to know what affects the rate of descent of an object through a liquid.
There are many factors that affect the descent of an object through a liquid such as:
1) Temperature of the liquid
2) Mass* of object
3) Size/surface area of object
4 Viscosity of liquid
5) Angle of descent
Temperature
I would like to investigate the correlation between temperature and time of descent. Reading suggests that the colder the liquid the longer it will take for the object to reach the bottom.
Mass*& Surface area/size
Gravity accelerates at 9.81 ms-1 independent of mass. Hence increasing the mass will not affect the experiment of surface area. Thus using an object of various sizes it would be possible to investigate the proportionately of size on the descent of the object.
Viscosity
I feel it is important to investigate the affects of how a more viscous liquid would impede the progress of an object descending through a liquid. Therefore I have included this factor into my investigation.
Angle of descent
I would like to observe the affects of the object descending at an angle. Such at sediment in a bottle is there a way in which bottles should be stored that may hasten descent?
Aim
To investigate the rate of decent of an object falling through a liquid (simulated by a ball bearing) and investigate some of the factors that will affect this.
Summary
I have completed this investigation by using many simple experiments to reach a firm conclusion on the rate of decent of a ball bearing through a liquid.
Size/surface area of ball bearing
The first set of experiments was to show the speed of five differently sized ball bearings descending through water. All five ball bearings seemed to reach their terminal velocity at the same timed interval.
Viscosity of liquid
The second set of experiments was to show the affects of a more viscous liquid (engine oil) on the decent of a ball bearing. Using the same method as the experiment for surface area, the ball bearing took longer to descend through the liquid.
Temperature
On the third experiment I varied the temperature of the oil. The difference was at a higher temperature the ball bearing descended faster through the liquid.
Angle of descent
Finally the fourth experiment compared angles of which the ball bearing descended through a liquid. The results showed a greater angle to the vertical reduced the speed of decent through the liquid.
Initial apparatus
The following apparatus was used to complete the investigation:
2.2 metre plastic tube (colourless)
Diameter 0.03 metre
900ml Water
900ml Engine oil
Five ball bearings with diameter and masses as follows:
Class Mass (g) Diameter (mm)
Very small 0.12 2.96
Small 0.88 6.98
Medium 4.07 9.98
Large 8.96 13.98
Very large 16.69 16.9
Clamp and clamp stand.
Tape measure
Stop clock
Tray
Bung
Magnet
Bunsen to heat oil (in a pan).
Note:
Each experiment shall be repeated 3 times and an average calculated to plot a graph.
Method and Results tables
Experiment 1
For the first experiment, I decided to measure the speed of a ball bearing descending through water.
My final decision on how to complete the experiment was to time the ball bearing at equally spaced intervals. At first, the obvious way to do this was to time at every 10cm interval. However this proved very difficult to do without some sought of mechanical or electrical aid to take the measurement. Therefore I settled for 20cm intervals but timed from a 10cm starting point. This worked particularly well and produced the results that follow this explanation.
Now that I had my first set of results, I thought I would introduce a variable of five differently sized ball bearings. This enabled me to investigate the surface area, mass* and how this effected the rate of descent.
The results of experiment 1 are as follows:
Very Small
Distance Timed (cm) Time taken(s) for ball bearing to pass through distance measured
1 2 3 Average
0-20 0.19 0.21 0.20 0.200
10-30. 0.17 0.18 0.20 0.183
20-40 0.18 0.19 0.20 0.190
30-50 0.20 0.18 0.19 0.190
Small
Distance Timed (cm) Time taken(s) for ball bearing to pass through distance measured
1 2 3 Average
0-20 0.24 0.25 0.24 0.243
10-30. 0.20 0.21 0.21 0.206
20-40 0.18 0.18 0.19 0.183
30-50 0.17 0.19 0.18 0.180
40-60 0.18 0.18 0.18 0.18
50-70 0.17 0.18 0.19 0.18
Medium
Distance Timed (cm) Time taken(s) for ball bearing to pass through distance measured
1 2 3 Average
0-20 0.32 0.33 0.32 0.323
10-30. 0.28 0.28 0.29 0.283
20-40 0.23 0.23 0.22 0.227
30-50 0.19 0.21 0.20 0.200
40-60 0.21 0.20 0.20 0.203
50-70 0.20 0.20 0.21 0.203
Large
Distance Timed (cm) Time taken(s) for ball bearing to pass through distance measured
1 2 3 Average
0-20 0.26 0.28 0.28 0.273
10-30. 0.23 0.22 0.20 0.217
20-40 0.20 0.21 0.20 0.203
30-50 0.20 0.19 0.20 0.197
40-60 0.20 0.20 0.20 0.200
50-70 0.20 0.19 0.2 0.197
Very Large
Distance Timed (cm) Time taken(s) for ball bearing to pass through distance measured
1 2 3 Average
0-20 0.33 0.32 0.30 0.317
10-30. 0.28 0.29 0.27 0.280
20-40 0.27 0.26 0.26 0.263
30-50 0.23 0.24 0.25 0.240
40-60 0.22 0.23 0.23 0.227
50-70 0.22 0.22 0.22 0.220
Experiment 1.2
The second part of the first experiment measured the time taken for five differently sized ball bearings to descend through water. The purpose of this part of the experiment was to make it more clear how surface area and mass* affects the rate of descent.
At this point and introduction of a sixth ball was used. This ball was 'almost' the same diameter as the tube it descended through (22mm in diameter) & (29.02g). Using this ball bearing, I could investigate more deeply into 'up thrust' that wasn't so noticeable with the smaller ball bearings.
The results of the experiments are as follows:
Ball bearing Time taken (s) to descend 1 metre through water
1 2 3 Average
Very small 1.92 1.96 1.94 1.940
Small 1.39 1.42 1.38 1.397
Medium 0.29 1.28 1.28 0.950
Large 1.27 1.30 1.29 1.287 Very large 1.64 1.62 1.63 1.630
Extra large 3.60 3.55 3.59 3.580
On investigation this experiment was not valid as it changed the parameters of the original investigation i.e. the liquid was forced under pressure between the ball bearing and tube.
Experiment 2
The second experiment had all the variables the same apart from the viscosity of the liquid that was changed. The liquid used for this experiment was engine oil.
Although it is easier to measure the rate of descent through engine oil because it is slower, the measured interval remained at 20cm.
The results are as follows:
Very small
Distance Timed (cm) Time taken(s) for ball bearing to pass through distance measured
1 2 3 Average
0-20 1.89 1.86 1.88 1.877
10-30. 1.83 1.77 1.80 1.800
20-40 1.76 1.75 1.78 1.763
30-50 1.76 1.79 1.77 1.773
40-60 1.77 1.78 1.77 1.773
Small
Distance Timed (cm) Time taken(s) for ball bearing to pass through distance measured
1 2 3 Average
0-20 0.86 0.84 0.85 0.850
10-30. 0.69 0.67 0.68 0.680
20-40 0.62 0.62 0.62 0.620
30-50 0.62 0.60 0.61 0.610
40-60 0.61 0.62 0.61 0.613
Medium
Distance Timed (cm) Time taken(s) for ball bearing to pass through distance measured
1 2 3 Average
0-20 0.45 0.49 0.46 0.467
10-30. 0.38 0.37 0.39 0.380
20-40 0.39 0.36 0.38 0.377
30-50 0.39 0.38 0.36 0.377
40-60 0.37 0.38 0.37 0.373
Large
Distance Timed (cm) Time taken(s) for ball bearing to pass through distance measured
1 2 3 Average
0-20 0.92 0.90 0.91 0.910
10-30. 0.77 0.77 0.76 0.767
20-40 0.48 0.49 0.49 0.487
30-50 0.48 0.46 0.46 0.467
40-60 0.49 0.48 0.47 0.480
Very large
Distance Timed (cm) Time taken(s) for ball bearing to pass through distance measured
1 2 3 Average
0-20 1.52 1.52 1.53 1.523
10-30. 0.68 0.69 0.67 0.680
20-40 0.71 0.71 0.70 0.707
30-50 0.72 0.70 0.71 0.710
40-60 0.71 0.70 0.69 0.700
Experiment 2.2
The second part of experiment 2 investigates the time taken for five various sized ball bearings to descend through engine oil. This allows me to investigate the affect of viscosity on the surface area of a ball bearing.
The results are as follows.
Ball bearing Time taken (s) to descend 1 metre through engine oil
1 2 3 Average
Very small 13.50 13.58 13.54 13.540
Small 5.02 5.05 5.02 5.030
Medium 3.38 3.39 3.37 3.380
Large 3.58 3.60 3.57 3.583
Very large 5.48 5.49 5.48 5.483
Experiment 3
Experiment 3 varied the temperature of the liquid that a ball bearing descended through. I used engine oil for this experiment, as this would prove to have the most change in viscosity when heated. The medium sized ball bearing was used to complete this experiment however all other variables remained the same.
The results are shown below:
Temperature Time taken (s) to descend 1 metre through engine oil
1 2 3 Average
35 2.67 2.65 2.63 2.650
40 2.27 2.29 2.30 2.287
45 2.20 2.21 2.19 2.200
50 2.13 2.17 2.15 2.150
55 1.90 1.91 1.92 1.910
60 1.88 1.72 1.81 1.803
Experiment 4
The fourth and final experiment was to measure the rate of descent of a ball bearing through a liquid at varied angles to the horizontal. I decided to take measurements at every 10o to the vertical.
This experiment would then allow me to investigate and observe if there is any change to the rate of descent caused by the applied angle. I only required taking measurements up to 80o as at 90o the ball bearing would not descend.
The results are shown below.
Angle Time taken (s) to descend 1 metre through engine oil
1 2 3 Average
10 1.69 1.82 1.66 1.723
20 1.87 1.94 1.90 1.903
30 2.20 2.15 2.17 2.173
40 2.46 2.37 2.39 2.407
50 2.76 2.71 2.72 2.730
60 2.92 2.96 2.90 2.927
70 3.54 3.50 3.52 3.520
80 6.15 6.10 6.30 6.183
The next section that starts on the following page displays graphically the results and other relevant information of the experiments mentioned in this report.
Conclusion
A number of conclusions can be drawn from my investigative work into the rate of descent of a ball bearing through a liquid and the factors that affect this.
1) I have found that one of the major factors effecting the ball bearings descent is the size of the ball bearing. From the discussion I mentioned the way in which the liquid flows around the ball bearing as it descends. This proved along with my experiments that the larger the ball bearing the slower the rate of descent. This occured in both engine oil and water.
2) The second major factor was the viscosity of the liquid in which the ball bearing descends. The more viscous liquid made the ball bearing descend at a slower rate.
I can also conclude that the temperature of the liquid in which the ball bearing descends through can increase or decrease the rate of descent. With a higher temperature the liquid becomes less viscous and the ball bearing descends at a faster rate.
3) I have found that the angle in which the ball bearing descends through will decrease the speed of when it will reach the bottom. However as I mentioned in the discussion an extra force was acting upon this and therefore made this experiment invalid.
4) The final conclusion to be drawn from my investigation, is that the ball bearings seemed to reach their terminal velocity in the same timed interval. For experiment 1 it was 40-60 cm and for experiment 2 this was also 40-60. Therefore I would be able to conclude with a third liquid that it may be possible that the liquid does not effect the point in which a ball bearing reaches its terminal velocity.
However I can conclude that the size of the ball bearing and also the mass does not effect where it reaches its terminal velocity. As you already know, if two objects of the same size but with different masses are dropped from the same height they will descend and hit the ground at the same time. It is only air resistance that will affect the descent if the objects size is slightly different. I can relate this to my experiments in finding the terminal velocity of the ball bearings through the liquid, and therefore explain why the occurance happened with only a slight varience with the very large ball bearings.